Current Market Data

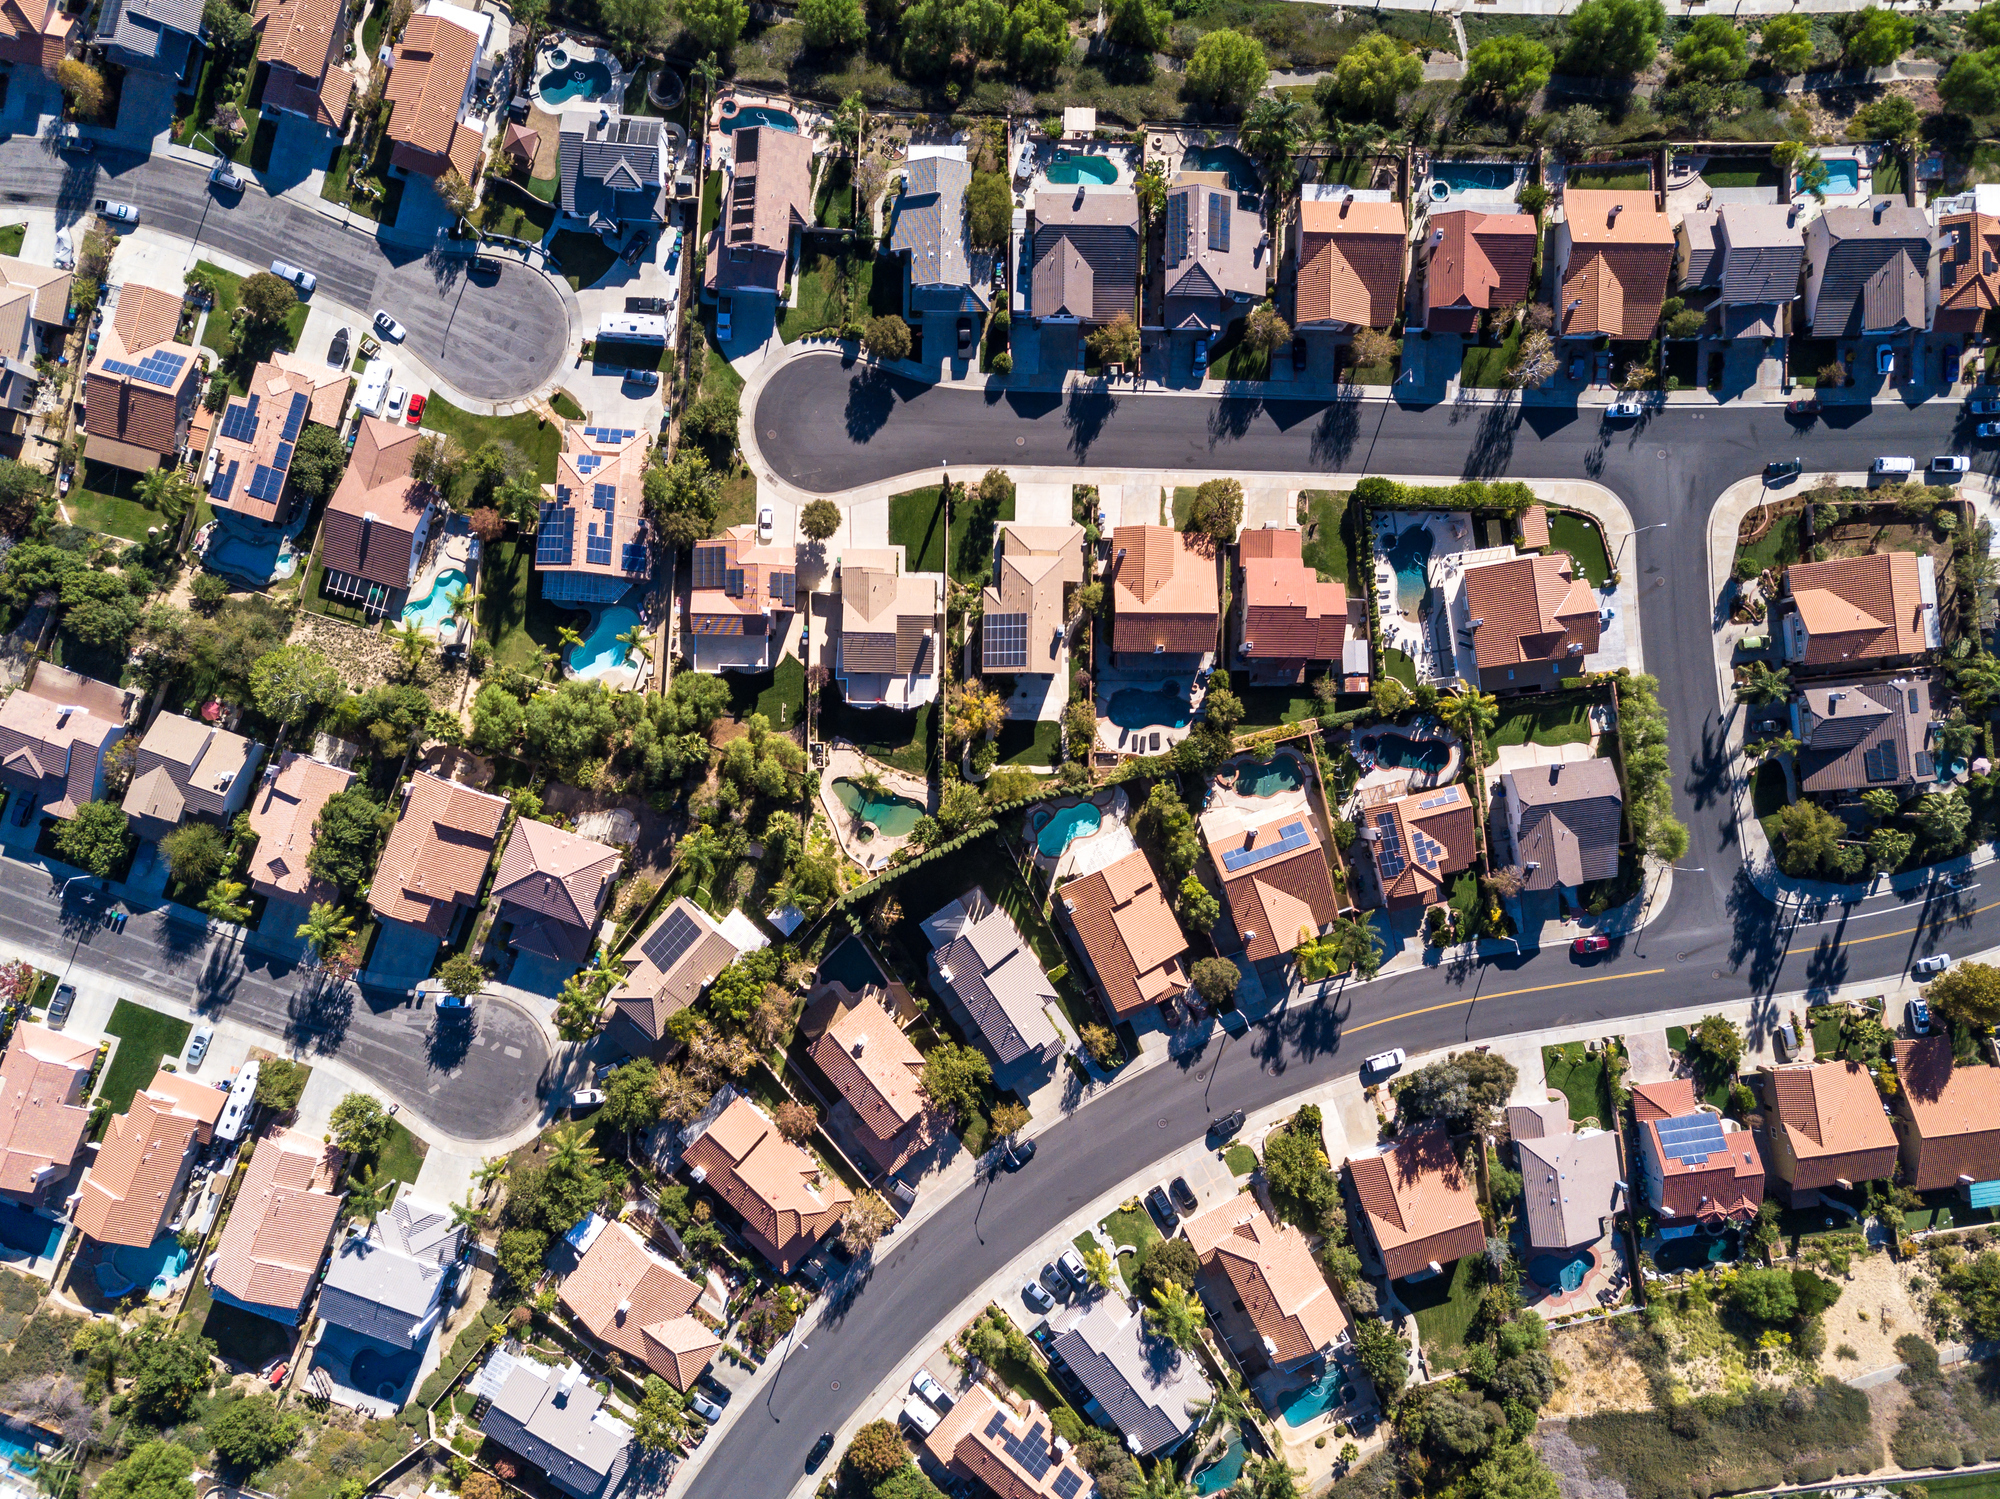
Last year’s en-masse move to remote work has driven what Zillow has dubbed the Great Reshuffling, as homeowners working from home have paused and reevaluated where and how they live.
The increase was driven by a 21.6% month-over-month spike in the rate of new multifamily construction. Single-family housing starts, meanwhile, slid 2.8%.
September’s reading of 76 was up one point from August, despite lingering challenges with labor and the building-material supply chain, the National Association of Home Builders reported, citing the latest NAHB/Wells Fargo Housing Market Index.
Month over month, home sales were down 3.5%, and the median sale price declined 1.2% to $335,000.

Wonder where Chicago residents are headed? You might be surprised.
Illinois had the highest foreclosure rate in the nation in August 2021, according to new data from ATTOM’s U.S. Foreclosure Market Report.
Pending home sales in August rose just 9%, the slowest growth since June 2020, according to a new Redfin report.
A decline in new home listings has had little impact on the market as far as demand is concerned, according to a recent Redfin report.
Income levels and mortgage rates gave homebuyers in June 129% more house-buying power than they had in 2006, according to First American Financial Corp.’s June Real House Price Index.
Even as the real estate market is showing signs of cooling and more sellers are dropping asking prices, median home prices increased by double digits from last year.
Also during the month, the median sales price rose to $390,500 from $370,200 in June, according to the U.S. Census Bureau and the Department of Housing and Urban Development.

In what’s been a historic, frantic market, homes selling for large sums over list prices have risen sharply since January.
“Much of the home-sales growth is still occurring in the upper-end markets, while the mid- to lower-tier areas aren’t seeing as much growth because there are still too few starter-homes available.” — NAR chief economist Lawrence Yun

You might be surprised by the results of this survey.

“The bright spot in an otherwise underwhelming report comes from the increase in the overall number of permits issued, which can signal how much home construction is in the pipeline.” — First American deputy chief economist Odeta Kushi
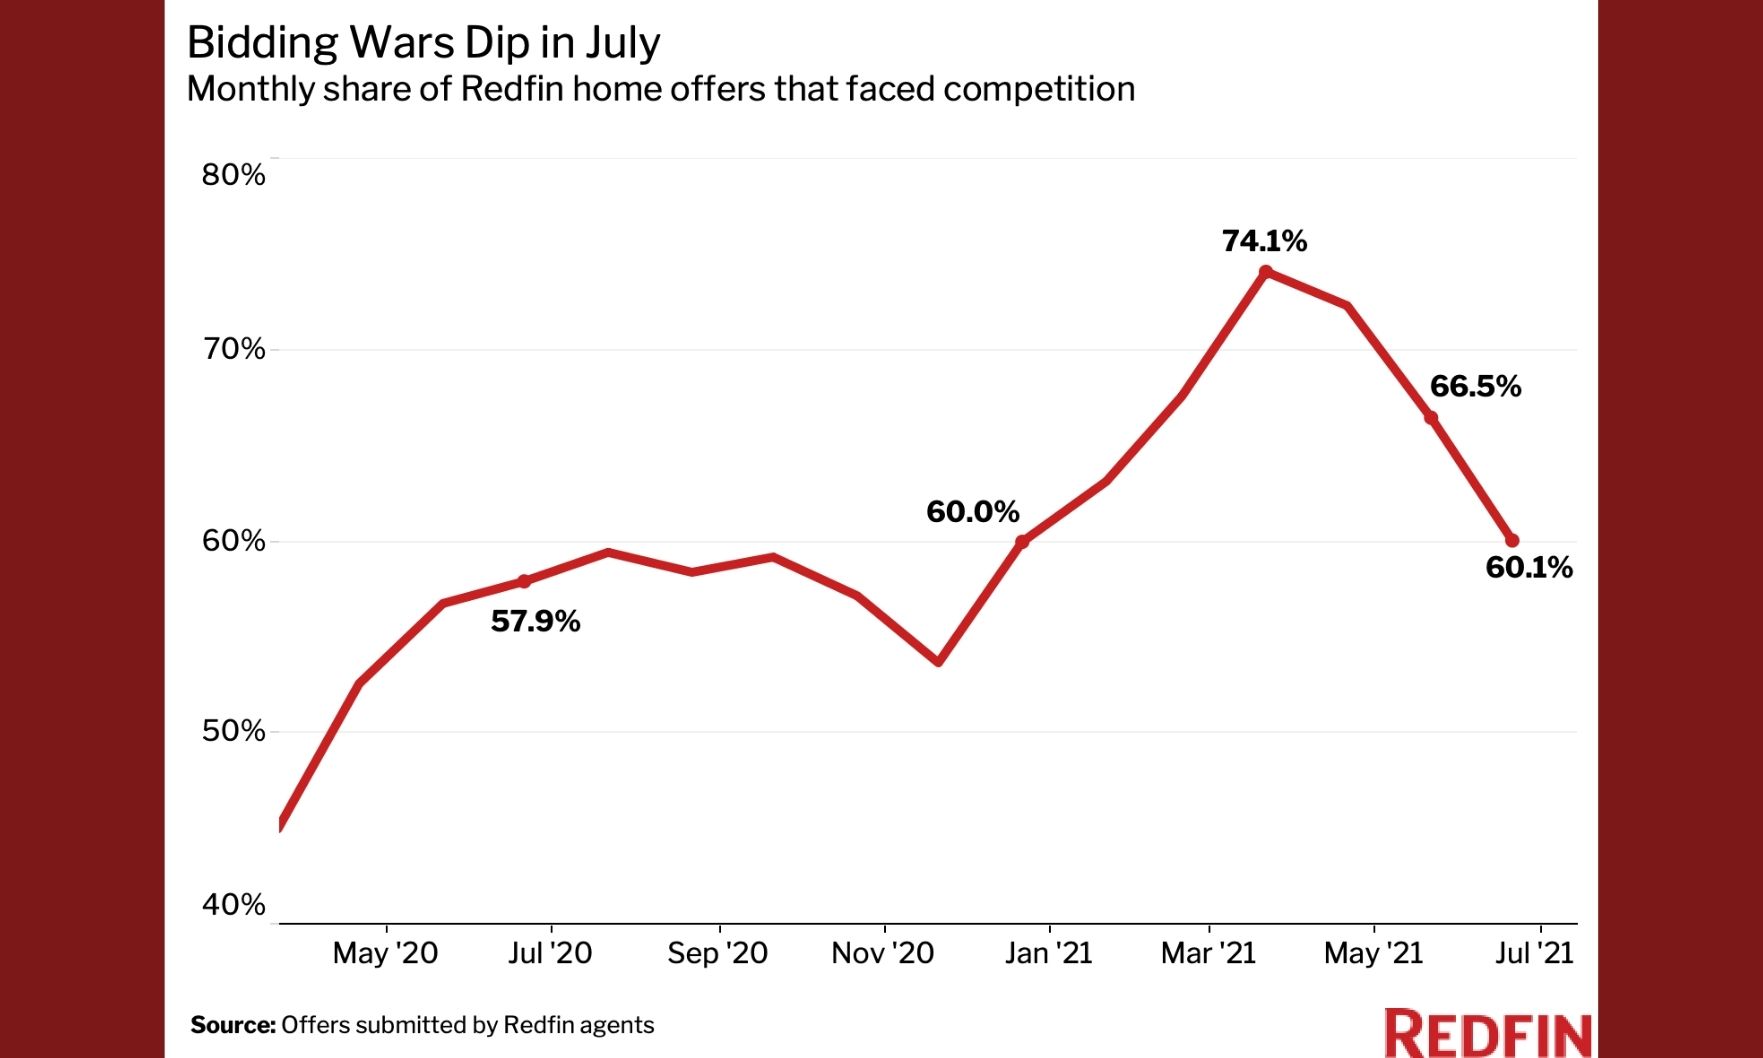
Following months of sky-high prices paired with manic competition — driven by limited supply — the frenetic housing market is starting to cool down. Somewhat.