
Current Market Data
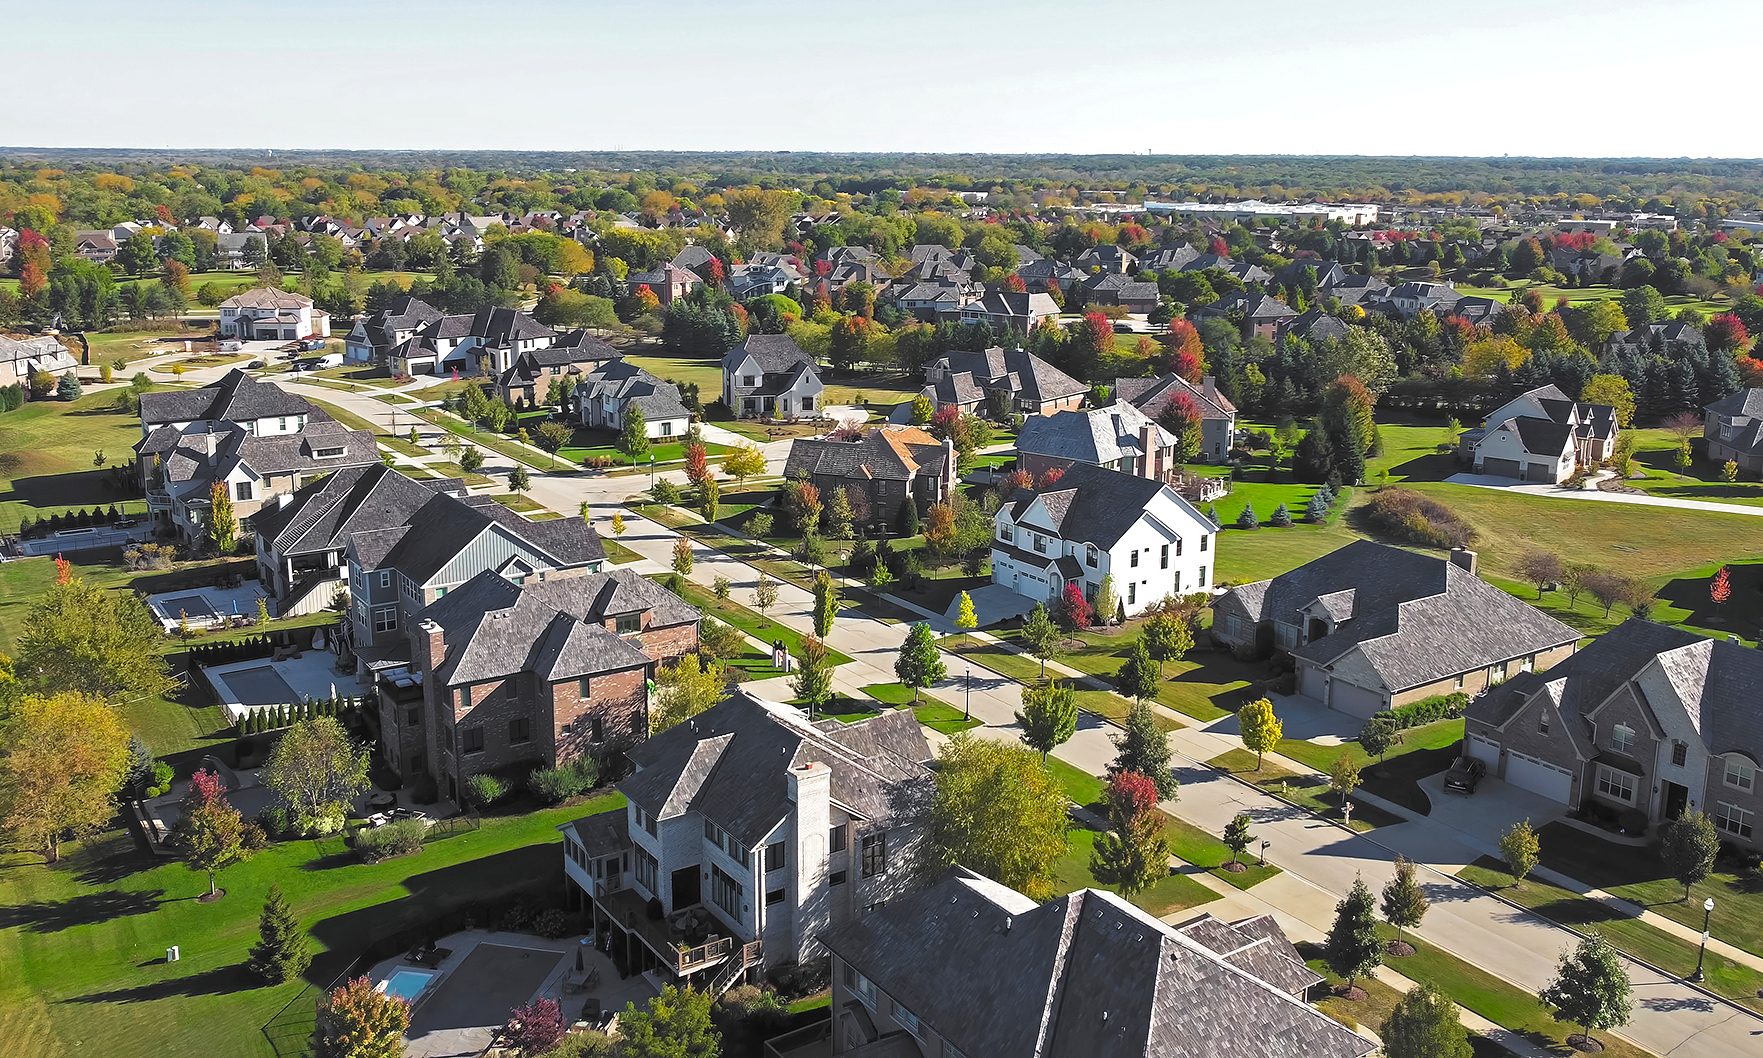
While home sales overall were down in September throughout Chicagoland, some suburbs remained very active, according to data from Mainstreet REALTORS®. In September, detached home sales were down 1.1% year over year, while attached home sales declined 6.7%. A

Economists were expecting a monthly decline in the annual sales rate.

Popular bathroom upgrades in 2026 include bolder accents, specialized water features and structural changes.

There were 2,672 detached homes sold in August, down 4.1% from 2,787 during the same month last year.

S&P Dow Jones noted that although prices rose almost 2%, in real terms, they were down, thanks to inflation, which registered 3.4% in July.

New-home inventory fell to its lowest level since December.

The month-over-month bump in contract signings was still below the pace of last August.

Since the Hispanic Wealth Project’s founding in 2014, Hispanic household wealth has more than tripled across the U.S.

In Chicago, buyers who wait until the last week of September to buy stand to see 16.8% more active listings.
At the same time, the median-sales price rose again, as months’ supply of homes for sale hit a 10-year high.

The increase in purchase activity offset a decrease in refinancings.

Over the past year, 30.9% of rental listing page views in Chicago came from out-of-towners.
The pace of home-price growth rose nationally but with significant regional differences.

Last month, the median sale price for a detached home in Chicagoland hit $450,000, compared to $420,000 last year.

Buyers are reportedly looking for homes that reflect how they actually live, not how they could be living.
Nationally, home sales in the 46 metro areas surveyed by REMAX rose 2.5% year over year and slipped 5.7% month over month.