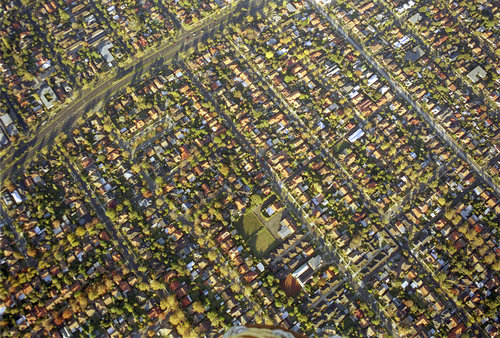
See our chart below for the top-selling suburban housing markets in Chicagoland in the first half of 2016, according to research from Redfin. To adjust between total home sales and the single-family/condo markets, click on the tabs.
| Suburb | Total Home Sales | YOY Change in Sales |
|---|---|---|
| Naperville | 1,402 | 11.98% |
| Aurora | 1,307 | 6.96% |
| Plainfield | 918 | 16.35% |
| Joliet | 853 | 13.43% |
| Elgin | 762 | -3.05% |
| Palatine | 660 | 22.91% |
| Arlington Heights | 648 | 6.40% |
| Schaumburg | 640 | 9.59% |
| Evanston | 577 | 10.54% |
| Bolingbrook | 566 | 5.01% |
| Suburb | Single-Family Sales | YOY Change in Sales |
|---|---|---|
| Naperville | 989 | 12.39% |
| Aurora | 854 | -2.06% |
| Plainfield | 743 | 16.28% |
| Joliet | 687 | 10.99% |
| Elgin | 539 | -13.34% |
| Bolingbrook | 464 | 8.16% |
| Arlington Heights | 423 | 1.93% |
| St. Charles | 412 | 9.28% |
| Crystal Lake | 407 | 26.79% |
| Wheaton | 365 | 11.62% |
| Suburb | Condo/Townhome Sales | YOY Change in Sales |
|---|---|---|
| Aurora | 422 | 20.57% |
| Naperville | 411 | 10.48% |
| Palatine | 331 | 9.97% |
| Evanston | 320 | 10.73% |
| Schaumburg | 313 | 15.07% |
| Des Plaines | 288 | 6.27% |
| Orland Park | 258 | 16.22% |
| Tinley Park | 249 | 27.69% |
| Arlington Heights | 225 | 15.98% |
| Elgin | 199 | 21.34% |
Photo credit: G LeTourneau, Creative Commons Attribution-Share Alike 3.0 Unported, https://commons.wikimedia.org/wiki/File:Ora_Pelton_House_(Elgin,_IL)_03.JPG
