Chicago is among the most segregated cities in America, and a new Estately analysis has reinforced the wildly unequal home values that such segregation creates.
In its study, Estately assessed the price per square foot and median sales price of homes around the city’s L stations, and the results were startling:
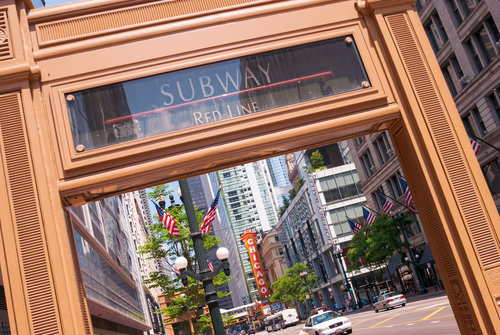
- With only one exception, the most valuable L stations are all in the Near North and Loop neighborhoods, with the Grand and Chicago Red Line stations coming out on top; the median sales price near those stations is $428,000 and $427,500, respectively.
- The three least valuable L stations are all located in Englewood; housing near the Halsted Green Line station, for instance, has a median sales price of just $14,750, or 3.45 percent of the housing values near first-place Grand.
- The discrepancies were pronounced across the full bottom and top 10 rankings. While the top 10 stations all saw price per square foot values of at least $348, the highest value among the bottom 10 was just $39 per square foot, or 11.2 percent of the previous value.
- Looking at entire CTA L lines, the Orange Line had the highest median price per square foot at $331, followed by the Purple Line ($326); the Brown Line ($305); the Pink Line ($270); the Red Line ($198); the Yellow Line ($164); and the Green Line ($99).
Sins of Housing’s Past
It is no coincidence that Estately’s analysis perfectly corresponds with Chicago’s segregated ghettos; indeed, we extensively detailed the history behind those very areas – and the local, state, and federal housing policies that created them – in our cover story “A Black and White City.”
Whether it was restrictive racial covenants that forbid black homeowners from buying property in certain areas, and thereby forced them into increasingly crowded, neglected neighborhoods; FHA policies that prohibited banks and homebuilders from lending to black prospective homebuyers; opportunist real estate professionals who sold black homebuyers properties “on contract” at inflated prices and under overly-strict terms; slum lords who purchased apartment buildings on the cheap from fleeing white owners and refused any maintenance or renovation to the new tenants; or “urban renewal” policies that displaced hundreds of black residents – all those collective housing policies conspired to create Chicago’s present-day housing/economic disparities, as Dearborn REALTIST Board President Tracey Taylor explained in our cover story.
“Those unlawful practices are still impacting African Americans today,” Taylor said. “Decades of systemic bias and unlawful real estate business practices have denied us the right then and, to a certain extent, continues to do so today. When you have a property that is equal distance to downtown Chicago, but the values are not equal, there is a huge disparity. Property valuation is key in determining the worth and economic development potential in a given neighborhood. If the playing field is not level, it’s an economically devastating loss for that community.”
See below for Estately’s full top 10 rankings, and click here for an idea of how, as a result of racist housing policies, Chicago’s neighborhoods changed over the 20th century.
| CTA Station/Line | Housing Market | Price Per Square Foot | Median Sales Price |
|---|---|---|---|
| Grand (Red) | Near North | $366 | $428,000 |
| Chicago (Red) | Near North | $355 | $427,500 |
| Merchandise Mart (Brown/Purple) | Near North | $360 | $410,000 |
| State/Lake | Loop | $356 | $401,531 |
| Clark/Lake | Loop | $357 | $400,000 |
| Randolph/Wabash | Loop | $354 | $392,500 |
| Lake (Red) | Loop | $352 | $390,000 |
| Clinton (Green/Pink) | Near West | $348 | $388,750 |
| Washington/Wells | Loop | $351 | $375,500 |
| Washington (Blue) | Loop | $353 | $375,000 |
| CTA Station/Line | Housing Market | Price Per Square Foot | Median Sales Price |
|---|---|---|---|
| Halsted (Green) | Englewood | $12 | $14,750 |
| Ashland/63rd (Green) | West Englewood | $16 | $20,250 |
| 63rd (Red) | Englewood | $22 | $27,000 |
| Cicero (Blue) | Austin/Cicero | $25 | $35,000 |
| Pulaski (Blue) | West Garfield Park | $34 | $37,000 |
| King Drive (Green) | West Woodlawn | $38 | $40,084 |
| Cicero (Green) | Austin | $35 | $42,550 |
| 69th (Red) | Greater Grand Crossing | $27 | $46,797 |
| Laramie (Green) | Austin | $35 | $49,500 |
| Garfield (Red) | Fuller Park | $39 | $57,500 |