Click on the tabs below to adjust between the city and suburban markets where homes sold the fastest in December, in terms of average days from listing to closing. Stay tuned for later this week, when we’ll report on Chicagoland market’s fastest markets for all of 2015.
| Suburb | Days on Market | Number of Transactions |
|---|---|---|
| Rolling Meadows | 72 | 23 |
| Mount Prospect | 90 | 41 |
| Skokie | 92 | 50 |
| South Holland | 92 | 24 |
| Brookfield | 96 | 23 |
| Burbank | 97 | 34 |
| Arlington Heights | 97 | 84 |
| Berwyn | 99 | 60 |
| Niles | 99 | 29 |
| Glendale Heights | 99 | 21 |
| City Neighborhood | Days on Market | Number of Transactions |
|---|---|---|
| Loop | 90 | 59 |
| Near West Side | 91 | 75 |
| North Center | 93 | 36 |
| Portage Park | 95 | 53 |
| Uptown | 97 | 51 |
| West Town | 97 | 131 |
| Ashburn | 99 | 28 |
| Washington Heights | 99 | 28 |
| Logan Square | 100 | 89 |
| Norwood Park | 100 | 31 |
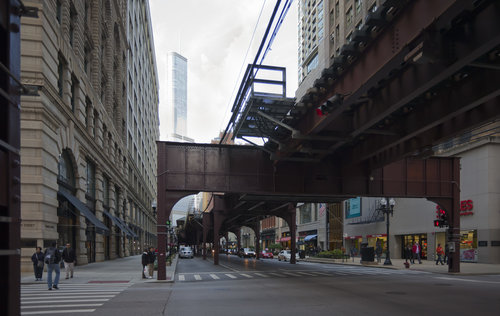
Photo Credit: Diego Delso, Wikimedia Commons, License CC-BY-SA 3.0, https://commons.wikimedia.org/wiki/File:The_Loop,_Chicago,_Illinois,_Estados_Unidos,_2012-10-20,_DD_03.jpg