June proved a very rough month for new home sales, but how bad are things, really, for the beleaguered homebuilding sector?
The headlines sure are negative – at a seasonally adjusted annual rate of 406,000, the sales of new single-family homes were down 8.1 percent from May to June and 11.5 percent from June 2013, according to the U.S. Census Bureau and Department of Housing and Urban Development.
Those are nasty numbers, but how bad is the overall picture for the new home marketplace? Here are some between-the-line stats worth knowing:
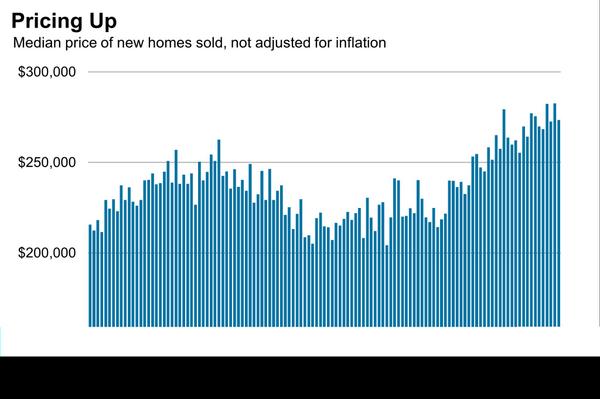
1. New Homes are EXPENSIVE – One reason for June’s dramatic drop in sales could be the expense of new homes; simply put, new homes are quite expensive, as homebuilders have tweaked their supply for a more and more exclusive, wealthy clientele. In June, for instance, the median sales price was $273,500 (up 9.5 percent year-over-year), while the average sales price was $331,400 (up 12.3 percent). Here’s a chart from the Wall Street Journal that shows the relative cost of new homes nowadays:
2. Beyond June, Sales are Flat – New home sales can be volatile month-to-month, so it’s often educational looking at sales on a more long-term basis…but sadly, even that perspective does not help 2014 very much. Through the first half of 2014, new home sales are running five percent behind 2013, with Q1 down 2 percent and Q2 down 6 percent.
3. Is 2013 a Fair Comparison? – One definite silver lining, though, comes from the 2013 housing market, which may not be the most apt comparison for 2014; after all, as Bill McBride noted on Calculated Risk, new home sales in the first four months of 2013 were up 26 percent from 2012, and all of 2013 was up 16.3 percent from the year before. Given those (unsustainable) increases last year, 2014 was bound to disappoint.
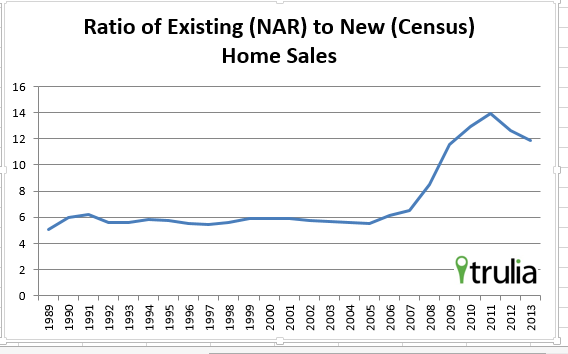
4. Still Oodles of Room for Improvement – At the end of the day, one thing remains clear – we still have quite a bit of ground to traverse before the overall home sale picture finds stable ground. The most telling stat to that fact is the existing-home sales to new home sales ratio. Typically, for every one new home sale, there are six existing-home sales, but with homebuilding in the dumps during the post-bubble years, that ratio spiraled way out of control, until finally, in 2011 and 2012, there were 14 existing-home sales to every new home sale.
And what is the ratio now, you may wonder? Twelve existing to one new. So yes, we still have plenty of progress to make!
Here’s a chart from Trulia tracking the ratio: