
Redfin’s Real-Time Demand Pulse for February found both home offers and home tour requests rose strong from December to January.
Homebuyer demand has started out the year incredibly strong, according to Redfin’s February Real-Time Demand Pulse, a measure of both home tours and signing offers with Redfin agents.
The number of customers writing home offers, the Real-Time Demand Pulse found, increased 70 percent from December to January, while the number of requests for home tours increased 57.9 percent over the same period.
Real-Time Demand Pulse – 2013 Building Off 2012
As Redfin noted in its analysis of the Real-Time Demand Pulse, those numbers are significant for two reasons:
- Firstly, both stats represent strong increases over the January 2012 numbers; in January 2012, home signings were up a notable 58.5 percent and home tour requests by 52 percent, but both measures were eclipsed by 2013’s statistics (again, 70 and 57.9 percent, respectively), suggesting the housing market’s recovery is continuing to expand beyond its 2012 levels.
- Secondly, and perhaps more importantly, additional data from the Real-Time Demand Pulse suggests that the housing market is not slowing in the early weeks of February, as it did in 2012.
- From Jan. 27 to Feb. 2 in 2012, home offers increased 12.1 percent, but requests for home showings fell 1.2 percent; in 2013, however, offers have risen 22.4 percent into the first week of February, and tour requests are up by 5.0 percent.
Sarah Coulter, an @properties agent working in Chicago’s North and West Side, said that she has been busier in 2013 than in 2012 too, with more clients seriously looking for properties; her colleagues, she said, have reported similar experiences.
“My colleagues have mentioned that they all are really busy writing contracts and getting them accepted,” she said.
For some additional perspective, here are a couple graphs showing the year-over-year rise in both segments of the Real-Time Demand Pulse:
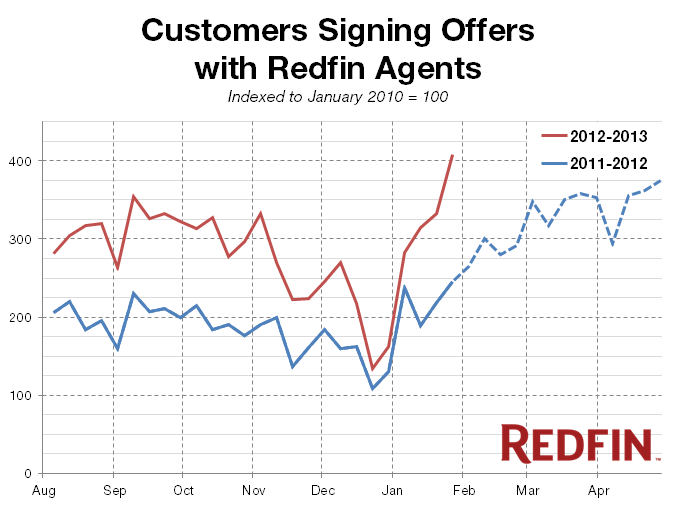
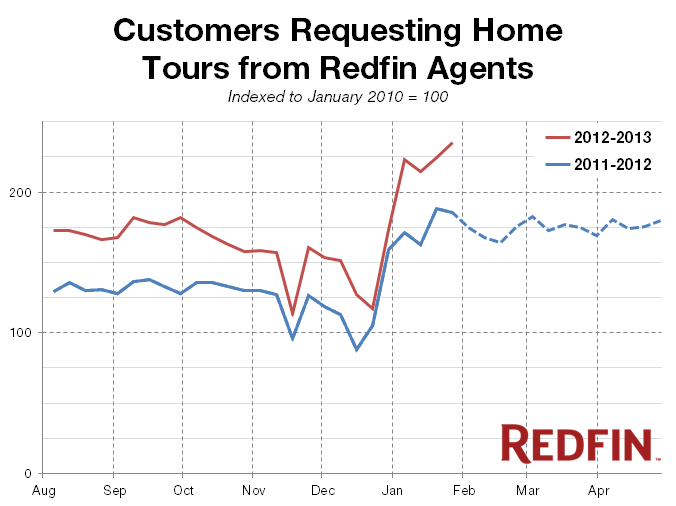
As the graphs demonstrate, home signing are even higher now than in the spring of 2012, and home tour requests are much higher than at any time in early 2012.
Are these findings consistent with what you’re seeing in your markets? And do such developments not suggest good things for the spring? Let us know in the comments section!