By the Numbers
The increase was driven by a 21.6% month-over-month spike in the rate of new multifamily construction. Single-family housing starts, meanwhile, slid 2.8%.
September’s reading of 76 was up one point from August, despite lingering challenges with labor and the building-material supply chain, the National Association of Home Builders reported, citing the latest NAHB/Wells Fargo Housing Market Index.

Month over month, home sales were down 3.5%, and the median sale price declined 1.2% to $335,000.
Illinois had the highest foreclosure rate in the nation in August 2021, according to new data from ATTOM’s U.S. Foreclosure Market Report.
Pending home sales in August rose just 9%, the slowest growth since June 2020, according to a new Redfin report.
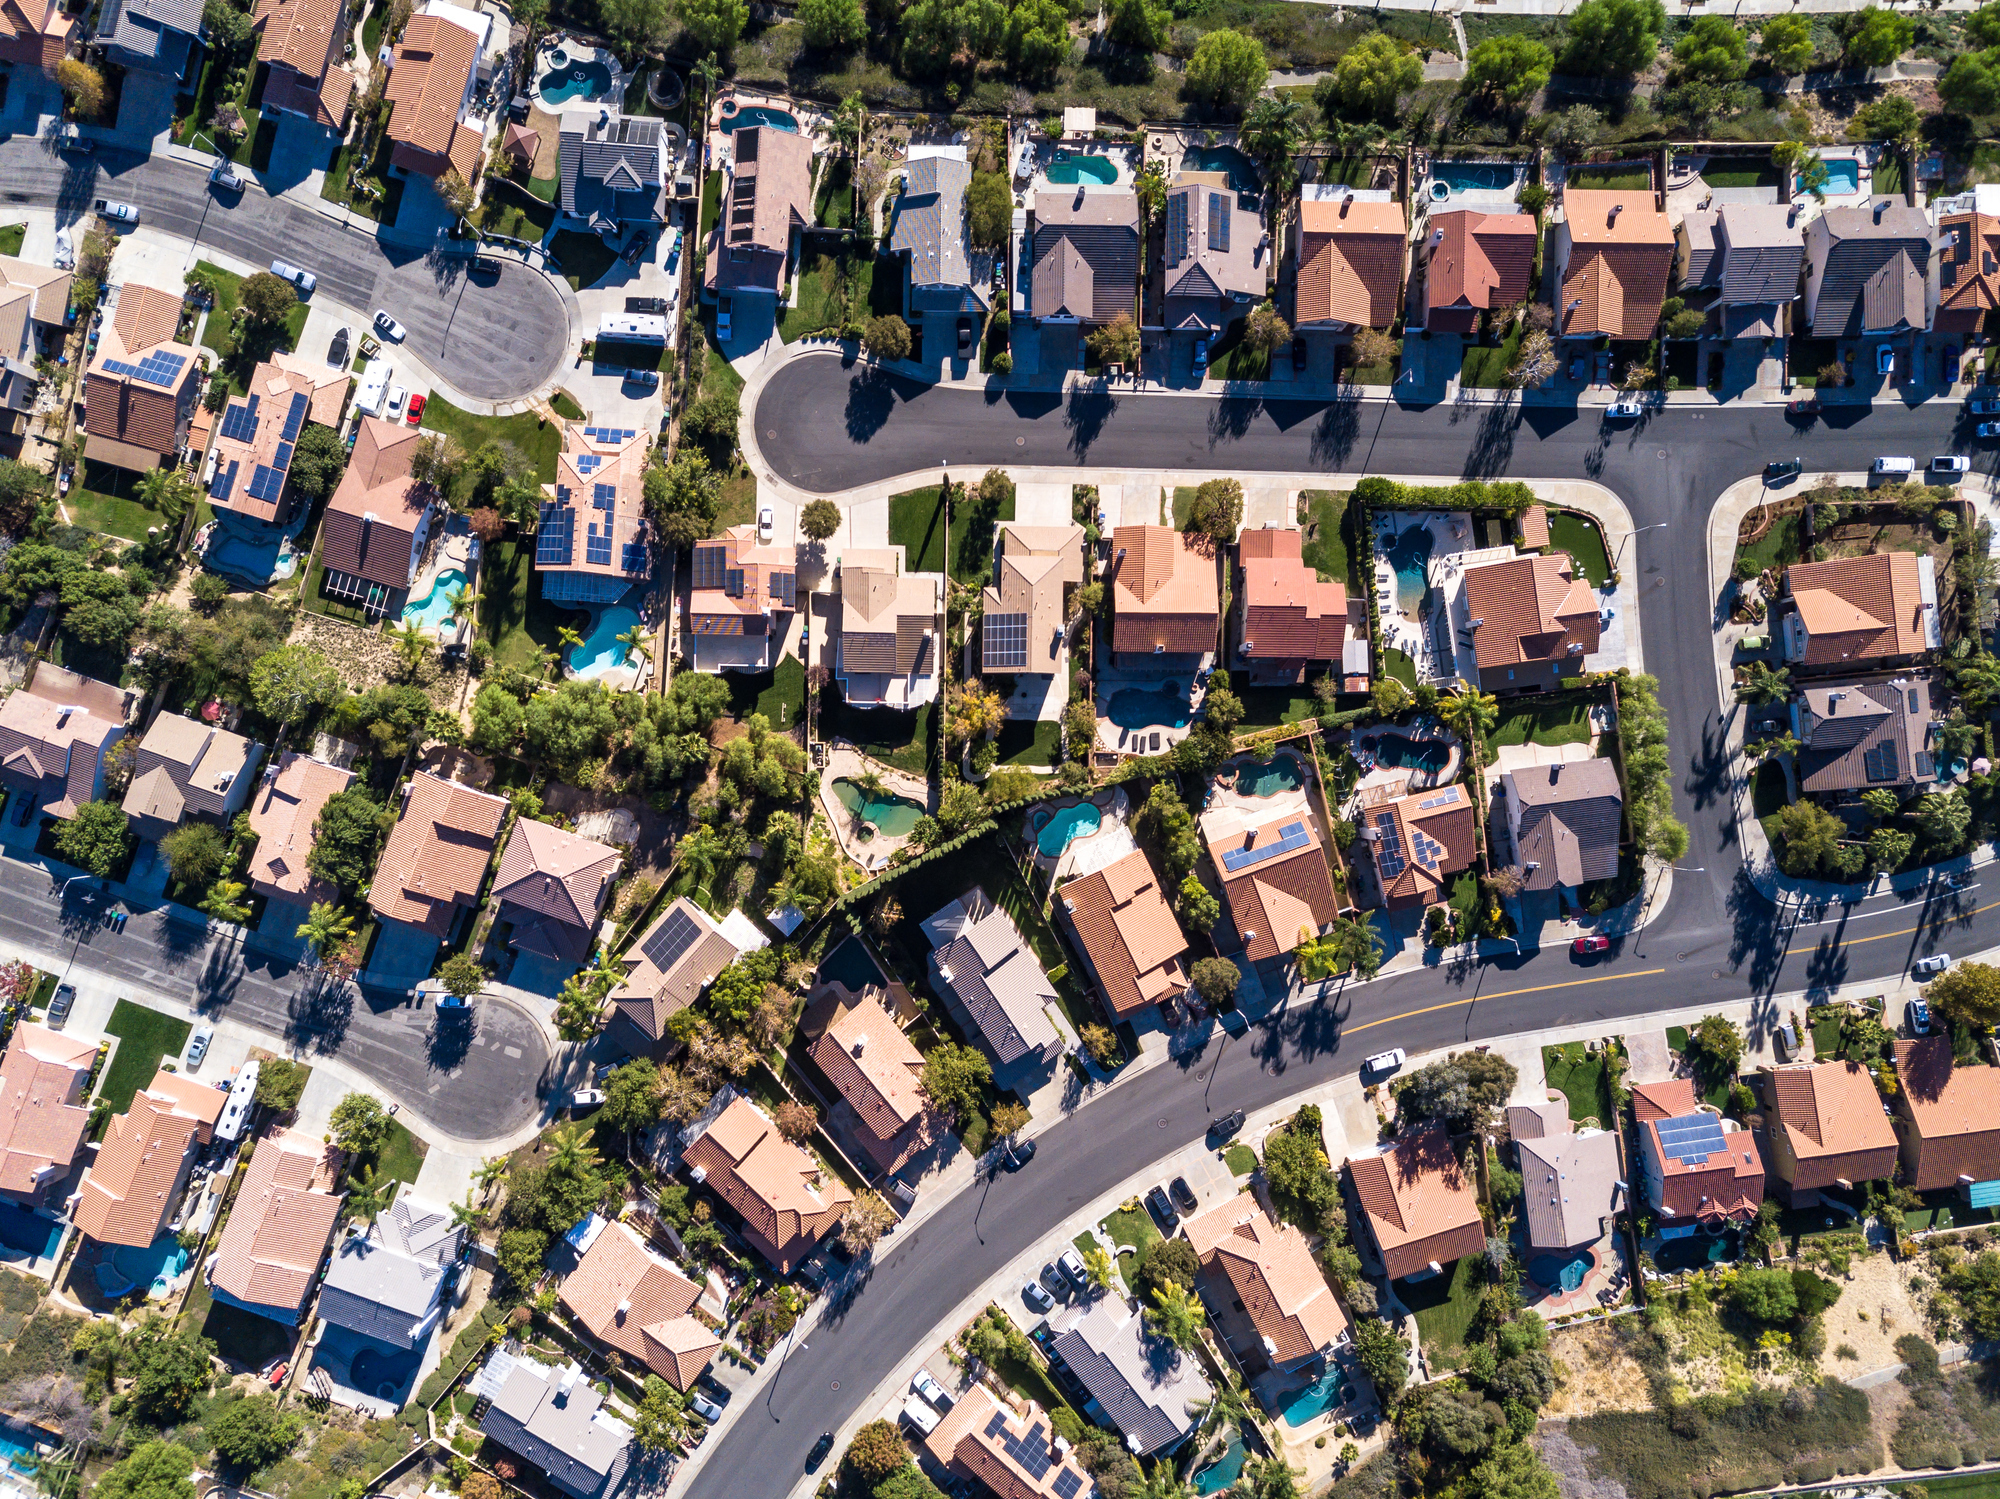
A decline in new home listings has had little impact on the market as far as demand is concerned, according to a recent Redfin report.

Also during the month, the median sales price rose to $390,500 from $370,200 in June, according to the U.S. Census Bureau and the Department of Housing and Urban Development.

“Much of the home-sales growth is still occurring in the upper-end markets, while the mid- to lower-tier areas aren’t seeing as much growth because there are still too few starter-homes available.” — NAR chief economist Lawrence Yun
“The bright spot in an otherwise underwhelming report comes from the increase in the overall number of permits issued, which can signal how much home construction is in the pipeline.” — First American deputy chief economist Odeta Kushi
Just 56.6% of homes sold during the quarter were affordable to families earning the U.S. median income of $79,900, according to the National Association of Homebuilders/Wells Fargo Housing Opportunity Index.
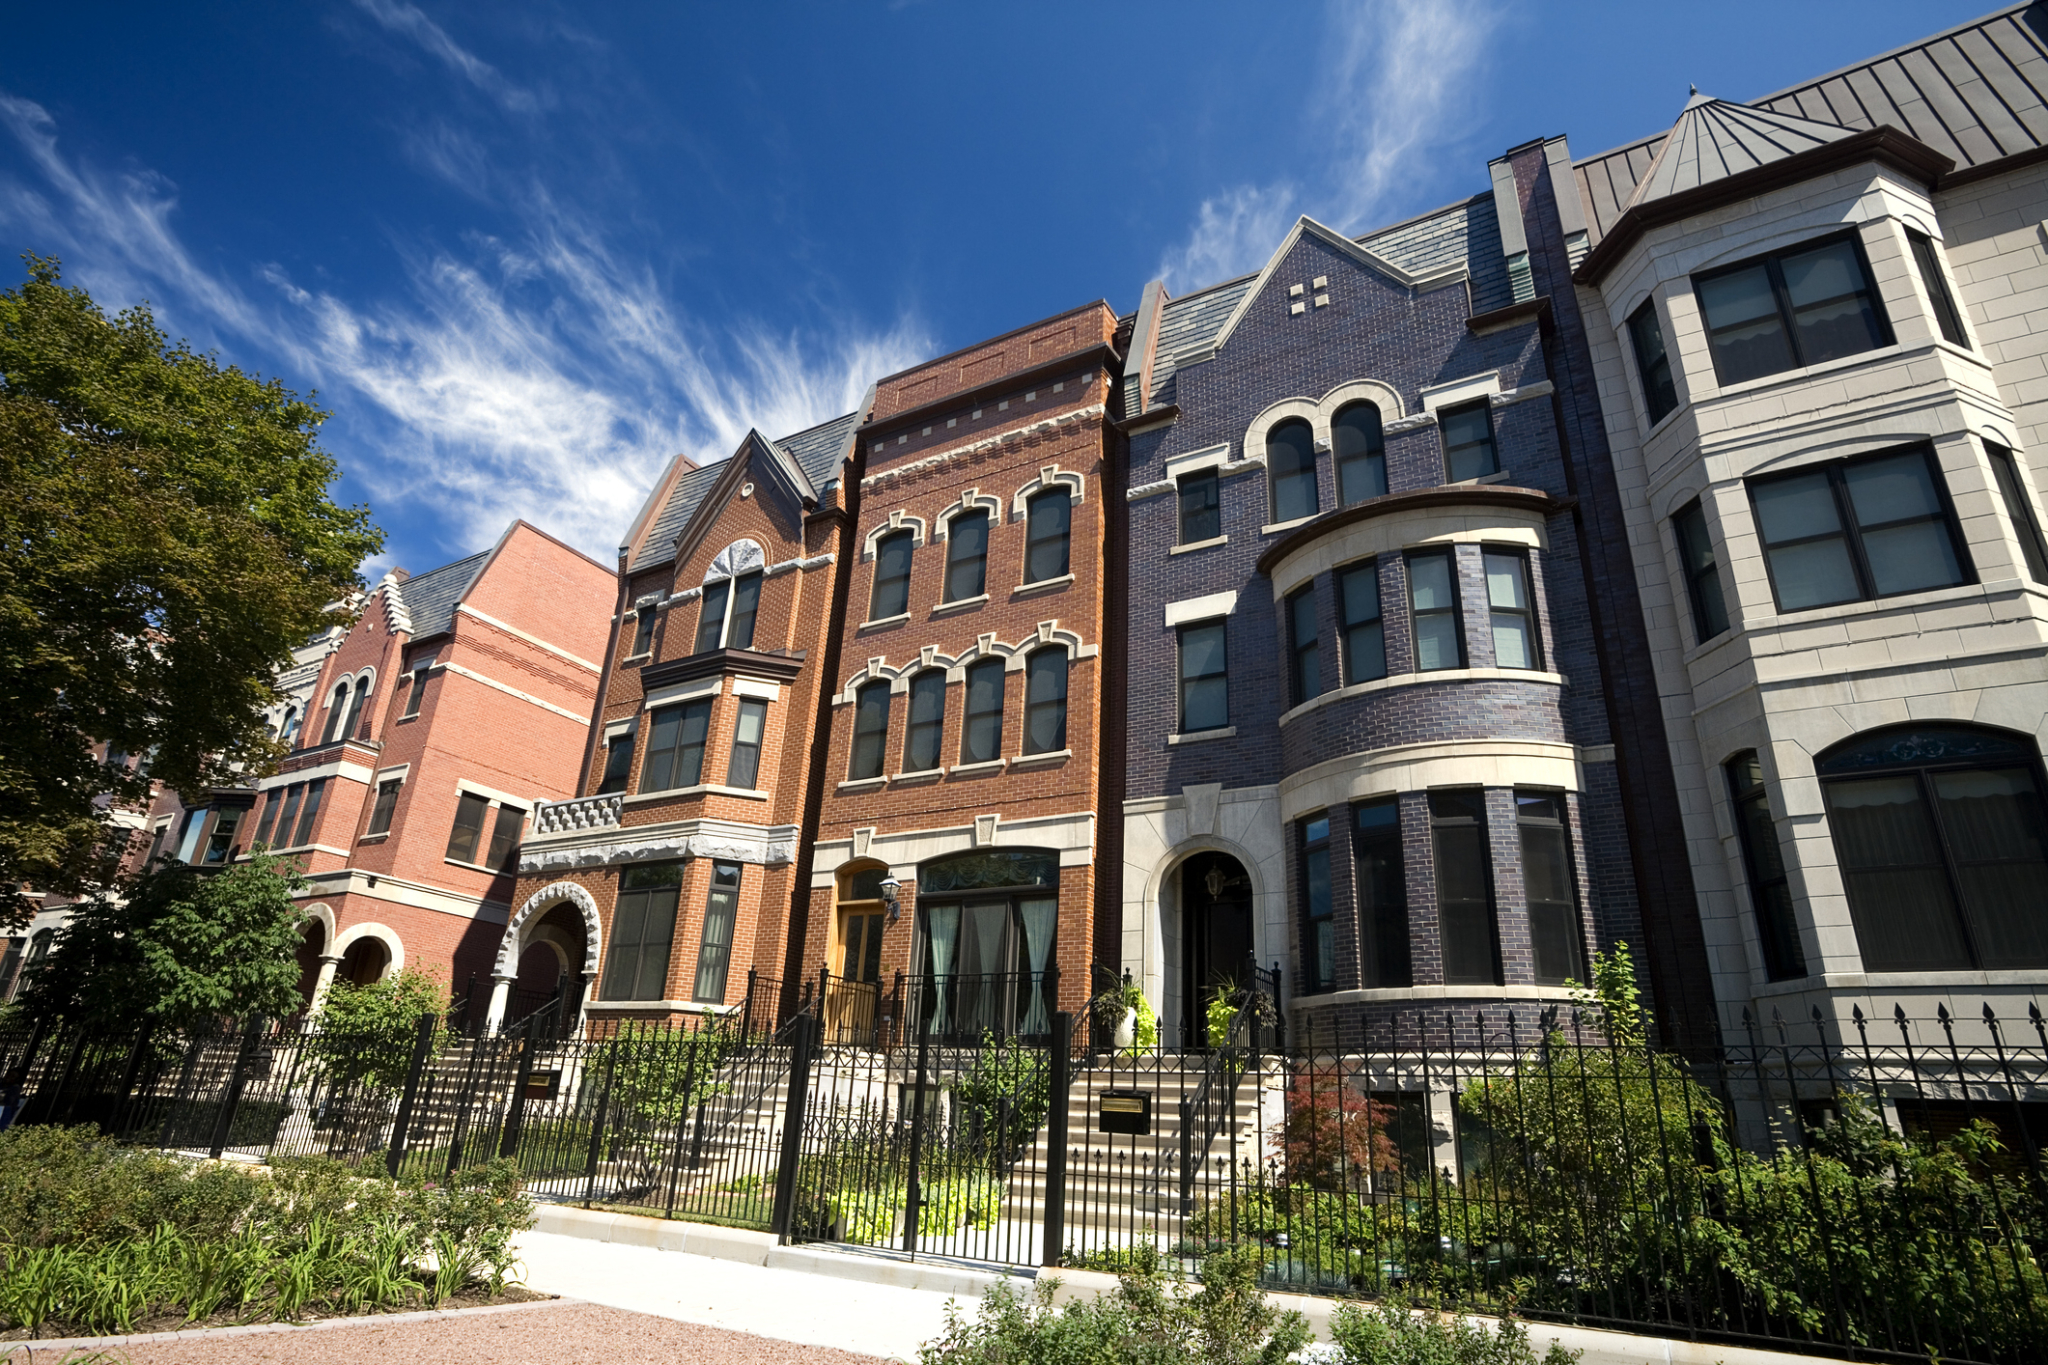
The U.S. Census Bureau and the Department of Housing and Urban Development reported that the median sales price slid to $361,800 from $380,700 in May.

At the same time, the median existing-home price for all housing types in May was up 23.4% on an annual basis, as every region in the country registered price increases.

Meanwhile, the seasonally adjusted purchase index declined 6% from the previous week, the Mortgage Bankers Association reported.
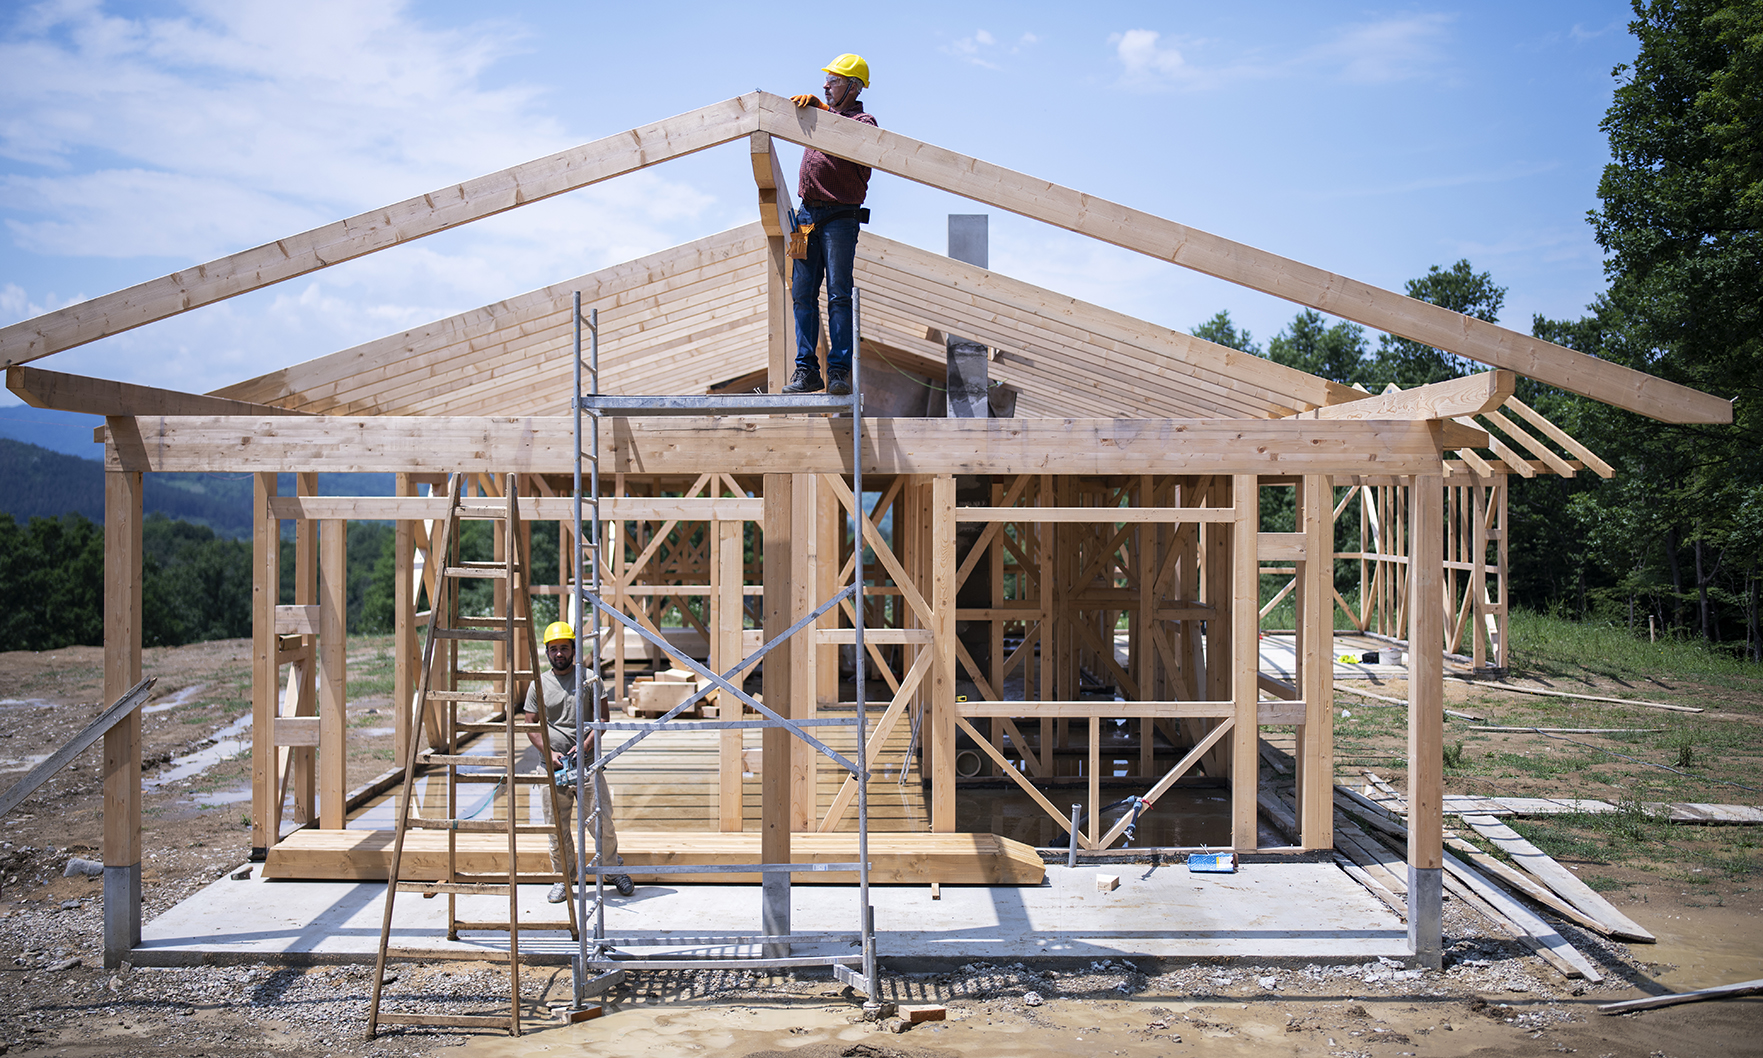
Privately owned housing units authorized by building permits in June came in at a seasonally adjusted annual rate of 1,598,000, down 5.1 % from the revised May rate of 1,683,000, but 23.3% above the year-ago rate of 1,296,000.

July’s reading of 80 was down one point from June, but still signaled strong demand for housing, the National Association of Home Builders said.
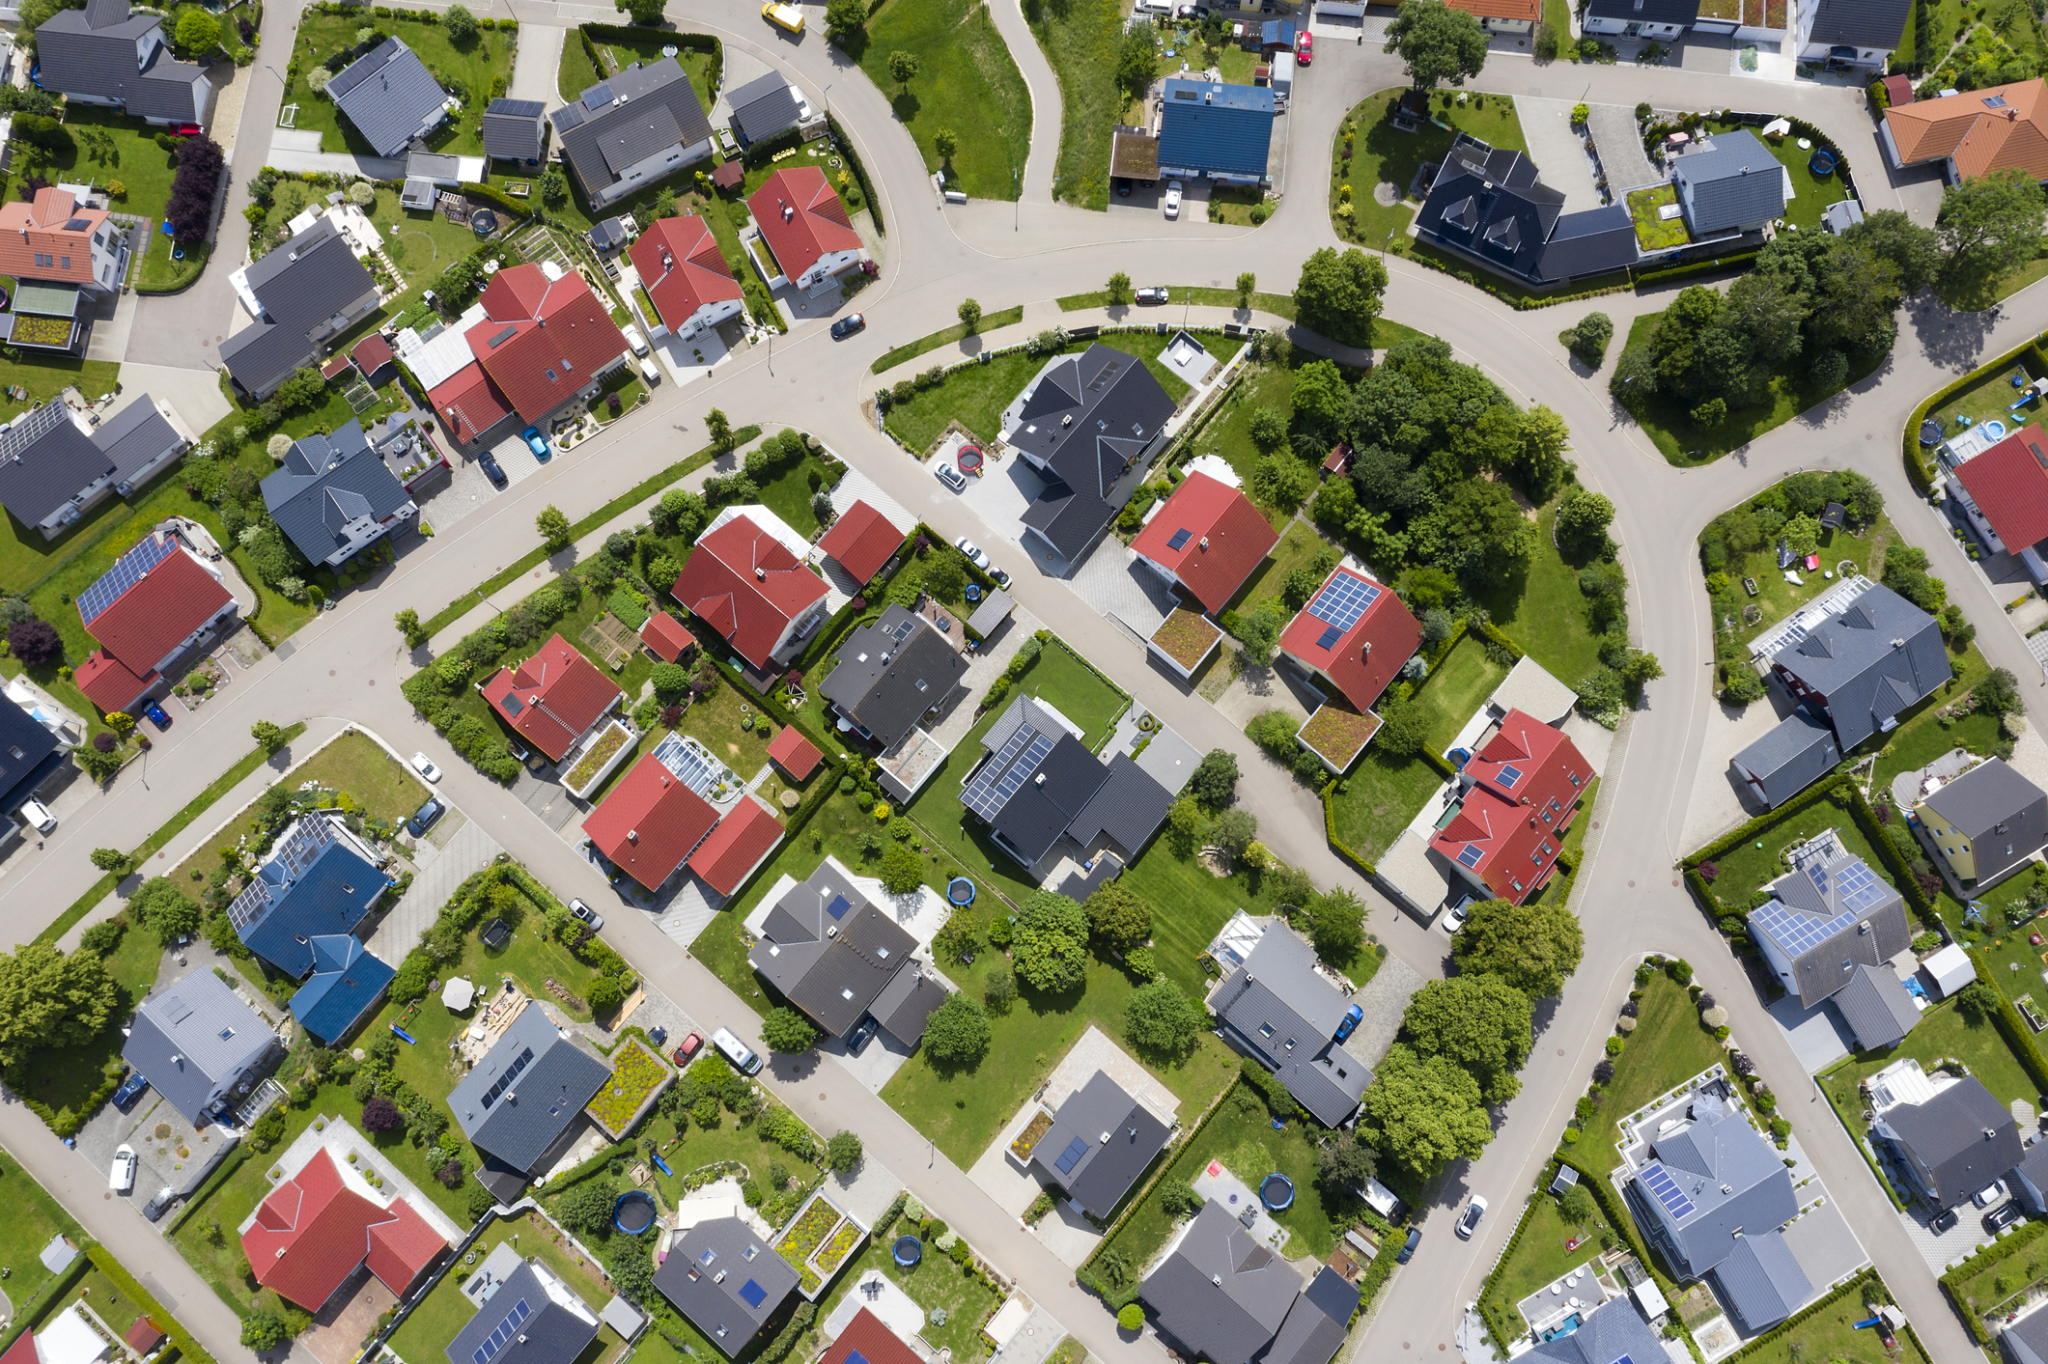
During the four-week period ended July 11, the average weekly share of homes for sale with a price drop passed 4% for the first time since September 2020.