Infographics

The “buying versus renting” debate is one of the quintessential rumbles in American business circles, but a new Trulia study has made it clear – here in Chicagoland, buying beats renting by a wide margin. For its analysis, Trulia

Last week, we reported on the Cook County school districts that commanded the highest home prices, and now we’re back with similar analysis for DuPage County. Utilizing data from realtor.com, our list below compares the median price of the homes in DuPage’s school

Cook County features some of the top school districts in the country, but which of those districts have the most in-demand housing markets? A new analysis from realtor.com provides a unique answer to that question. Comparing the median price

Winnetka is the most expensive housing market in Illinois, according to the annual Home Listing Report from Coldwell Banker. With the average price of a four-bedroom, two-bath single-family home going to $840,355, Winnetka came out on top in the
In our new Real Data report, we’ve detailed the agents who closed September’s top home sales throughout Chicagoland. Click on the tabs below to adjust between the single-family, condo and townhome markets: Single Family Condo Townhome Single Family Sales Price Property

Few cities are more affected by the problems of student debt than Chicago, according to a new LendingTree analysis. Based on data from My LendingTree, the Windy City has one of the highest average student debt burdens in the country at $33,880.87. Our

Two of Chicagoland’s school districts carry the highest housing premiums in the nation, according to a realtor.com analysis. In the Kenilworth Sd 38 and Winnetka Sd 36 school districts, the median list price is far above the median for Cook County.

Last week, we reported on NAR’s “Profile of Real Estate Firms,” an exhaustive look at the composition of today’s realty businesses and a projection of where they are heading. Our first report looked at the state of real estate firms

This year has been a very positive one for Chicagoland’s real estate market: there have been 80,766 home sales thus far, a 4.8 percent increase over 2015; median sales price is up 4.7 percent to $225,000; days on market

The Chicagoland new construction market is putting up some of the most impressive numbers in the nation in 2016 performance, according to research from Dodge Data & Analytics. In August, Chicagoland saw more than $1.216 billion in total residential construction spending, a

See our chart below for the top-selling suburban housing markets in Chicagoland in August, according to research from Redfin. To adjust between total home sales and the single-family/condo markets, click on the tabs. When possible, we have also noted
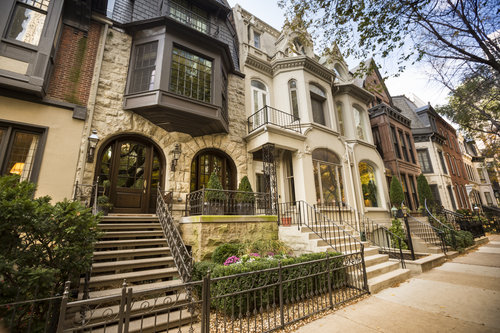
Home prices in the Chicagoland housing market posted the second-strongest monthly increase in the U.S., according to the latest Case-Shiller Home Price Indices from Standard & Poor’s. From June to July, Chicagoland prices rose 0.9 percent, which was ahead
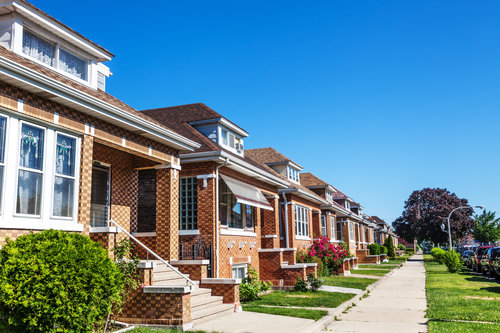
See our chart below for the top-selling Chicago neighborhoods in August, according to research from Redfin. To adjust between total home sales and the single-family/condo markets, click on the tabs. Total Home Sales Single-Family Home Sales Condo/Townhome Sales Neighborhood Total
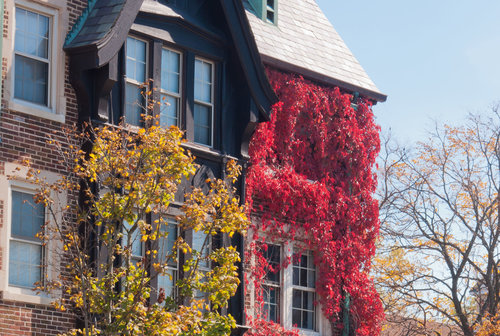
The Chicagoland housing market contains several of the most exclusive markets in the U.S., according to a new analysis from Coldwell Banker. Billing itself as “the most extensive home price comparison tool in the United States,” the Coldwell Banker Home Listing

In our new Real Data report, we’ve detailed the agents who closed August’s top home sales throughout Chicagoland. Click on the tabs below to adjust between the single-family, condo and townhome markets: Single Family Condo Townhome Single Family Sales Price Property

For some time now, agents and analysts alike have wondered why so few Millennials are buying homes, but new Census data has provided a remarkably straightforward answer – they’re all living at home with their parents. Compiled by Time magazine,