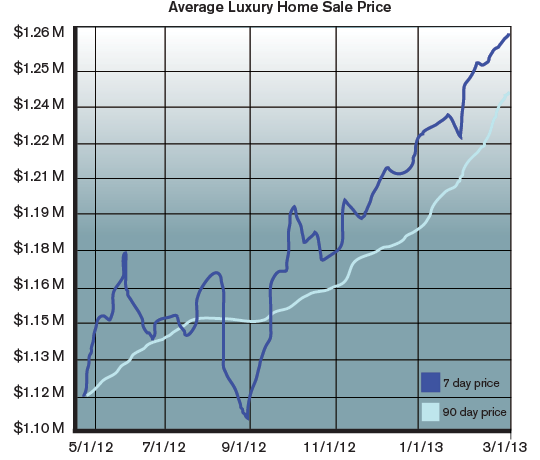
The Institute of Luxury Home Marketing (ILHM) has so many tools that can help luxury agents. One valuable tool is the weekly ILHM National Luxury Market Report. I recently spoke with an ILHM member who was using this report in early April to motivate a buyer to make a buying decision before the market shifts to a seller’s market. Using the National Luxury Market Report, she showed her buyer that prices are rising, inventory is low and the market is moving away from a buyer’s market.
The ILHM National Luxury Market Report is an up-to-the-minute look at trends in the luxury market around the country based on active listings from more than 30 representative markets. Agents can find the report on ILHM’s website (luxuryhomemarketing.com), and it is updated every week. While the executive summary of the national market is available on the ILHM blog and website, the full report and weekly city reports are only available to members.
For example, if you were to look at the April report, you’d see that the list price of luxury homes is trending up, asking price per square foot is rising, inventory levels have been falling, average days on market for current listings is holding at about six months and we are moving out of a buyers’ market toward a balanced market. If you have a buyer who is on the fence, you might share this info as an incentive to make a smart buying decision before it becomes a seller’s market. Use this info with a seller to talk about the advantages of selling while inventory levels are low, which means there are fewer competitive properties. One of ILHM’s members recently used this report to give a presentation on her local luxury market to her community’s Rotary Club. Institute members also have access to this information for about 30 individual metro markets.
Many members also post the PDF of the executive summary of the national report or their local metro area market report on their own website; this is a smart way to set themselves apart as professionals who know the luxury market. More important, this current market data allows them to better advise their buyers and sellers.
The chart below, part of the report, shows the seven-day and 90-day rolling averages for median list price, days on market, and inventory for the national composite – a snapshot of how, together, the luxury markets around the country are performing.

COPYRIGHT 2013 INSTITUTE OF LUXURY HOME MARKETING REPRINTED WITH PERMISSION