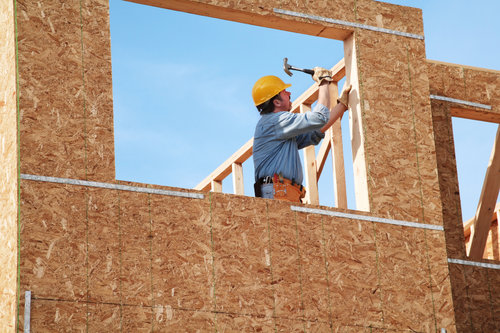
How was 2014’s homebuilding market better than 2013’s? Allow us to count the ways…
The numbers are in, and they’re quite clear in their conclusions – by every possible metric, 2014’s homebuilding market represented a strong improvement over 2013.
But how, specifically, was that the case? Below, we’ve broken it down to the three main ways:
1. Building Permits – Firstly, building permits, which are issued for future construction projects, showed positive movement in 2014, growing 4.2 percent over 2013 to 1.032 million permits; similarly, single-family home permits were up 4.5 percent, and multifamily permits were up 8.7 percent.
2. Housing Starts – Perhaps the most encouraging growth, though, came in housing starts, which rose 8.8 percent from 2013 to 2014 and reached 1.006 million; that tally brings housing starts to their first million-plus year since 2007.
Furthermore, there were 728,000 single-family home starts in 2014; that’s not only up 5 percent from 2013, but also the best showing for single-family starts since March 2008.
The true star of 2014’s housing starts, though, was the multifamily sector. Multifamily starts were up 17 percent over 2013, and they comprised 34 percent of total home starts, which is their highest market share since 1973.
And finally, it’s perhaps the most telling sign of all on today’s housing market: in 2014, multifamily starts were 40 percent above their 1990-2013 average; single-family starts, meanwhile, were 40 percent below their average of that same time period; construction has truly shifted to accommodate a changing demand for housing, one that prioritizes renting over owning.
3. Housing Completions – Lastly, housing completions (meaning new construction units that were completed and listed on the market) rose 15.5 percent over 2013, with single-family completions up 21 percent and multifamily completions up 37 percent; given the nationwide concerns with inventory, such stats are very positive.
