Where, among Chicago’s varied neighborhoods, were home sales the highest?
Earlier this week, we reported that home sales in the Chicagoland region jolted back to life in March, putting up some of its best numbers sine 2013.
How did that increase, though, translate to Chicago’s specific neighborhoods? Courtesy of the exclusive monthly data from our friends at Redfin, we put together a series of graphs that answered that very question.
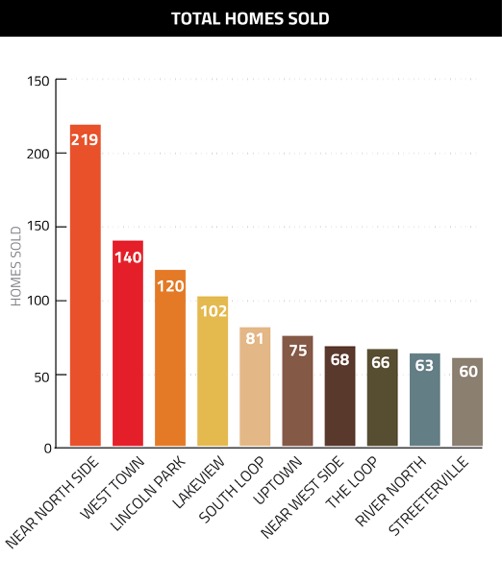
First, here is a graph that looks at total home sales across the city:
Unsurprisingly, the Near North Side was far ahead of the pack with 219 sales, but for all the neighborhoods, the most important stat is how dramatically sales improved from February to March. Near North’s 219 sales, for instance, was a 68.5 percent increase from February’s 130 sales; similarly, sales in West Town were up 112 percent – that’s not a misprint – and Lincoln Park sales were up 69 percent.
When we isolate the numbers for single-family home sales, though, the situation changes quite a bit:
Things were much more level in the single-family market, though No. 1 Ashburn actually saw its sales drop from 47 in February to March’s 31; both Morgan Park and Norwood Park, meanwhile, vaulted to No. 2 and 3 after not even being in the top 10 in February!
Finally, here’s our graph on condos and townhome sales:
We already spoke of the huge sale increases for the top three markets, so here’s an incredible stat on Lakeview’s condo market – sales rose from 54 in February to 102 in March, an 88.9 percent increase.
So clearly, at the neighborhood level, sales were up considerably!


