What counties in Chicagoland are seeing the most new construction activity?
Earlier this week, we reported that new construction in Chicagoland is at its highest level since 2008, with more than 6,000 housing starts in the 12-month period ending with 2015’s third quarter.
Those housing starts were spread out unevenly across Chicagoland, and courtesy of some exclusive numbers from MetroStudy, we assembled a number of graphs that show where new construction is highest.
This graph illustrates total housing starts in the area’s counties:
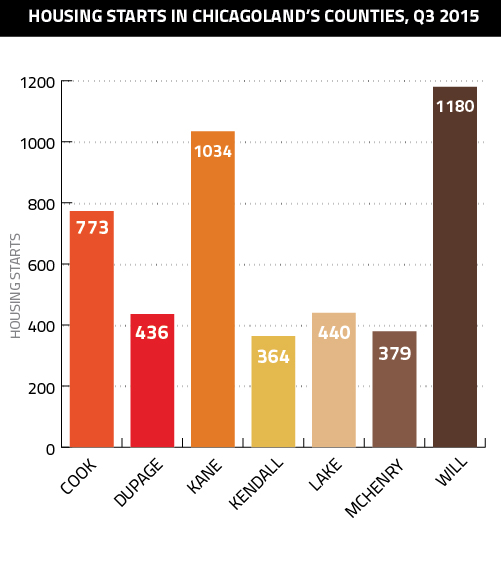
Both Kane and Will County were easily the most active new construction markets in Chicagoland, surpassing even the far larger Cook County.
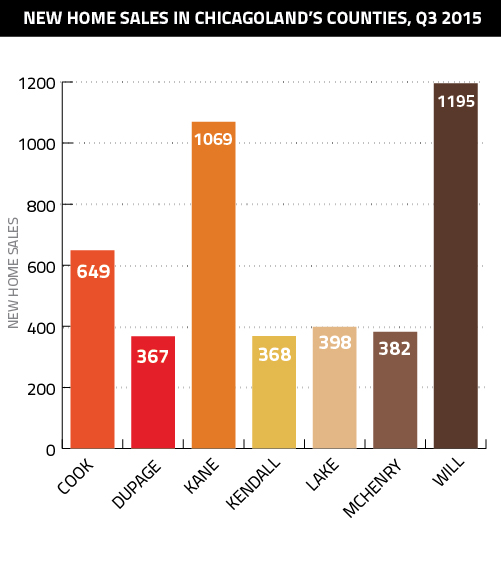
Those totals were very much consistent with new construction sales:
As consistent as those two graphs are, new construction’s growth since the downturn is a very different story. Below is a graph showing how home starts have risen since bottoming out (in all counties, new construction bottomed out in either late 2011 or early 2012):
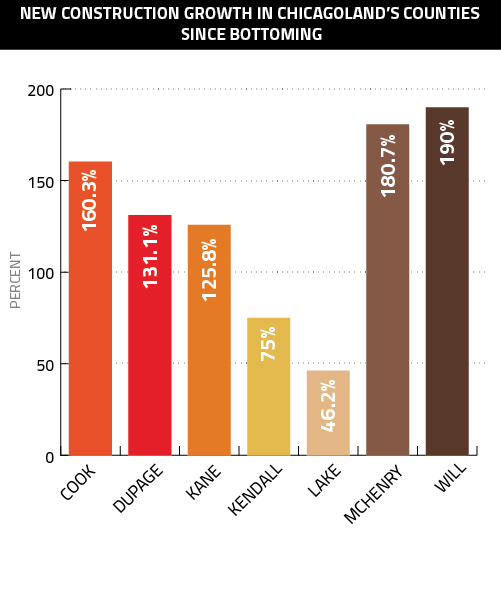
Although Will County is still on top, McHenry and Cook County are not far behind, and DuPage and Kane County still managed triple-digit increases; new construction in Lake County, meanwhile, remains relatively low.
Things change further when gauging how new home sales have grown from their post-boom bottom:
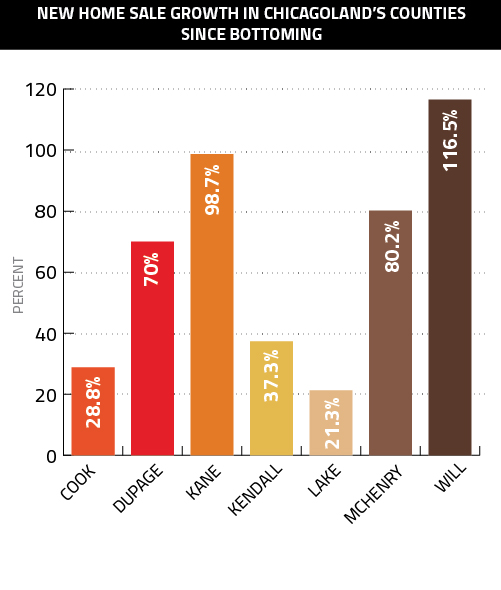
Will and Kane County are once again on top, with DuPage and McHenry County in relatively close third and fourth place, respectively. As with housing starts, Lake County’s new home sales were the lowest in the area, but Cook County’s 28.8 percent growth was only slightly higher.