January’s sales of existing homes were down 1.3 percent from December, according to a recent report from the National Association of Realtors. But year over year, existing-home sales were up 9.6 percent, marking the second straight month of year-over-year increases and pointing to an overall positive pattern.
“Existing-home sales are off to a strong start at 5.46 million,” said NAR Chief Economist Lawrence Yun in a press release accompanying the data. “The trend line for housing starts is increasing and showing steady improvement, which should ultimately lead to more home sales.”
Median prices for all housing types in January were up 6.8 percent year over year to $249,400, while total housing inventory was down 10.7 percent year over year, the lowest level since 1999. Unsold inventory is currently sitting at a 3.1-month supply. A year ago, there was a 3.8-month supply of inventory in the U.S.
“Mortgage rates have helped with affordability, but it is supply conditions that are driving price growth,” Yun said.
Not surprisingly, market time was down year over year. Homes were listed an average of 43 days last month as compared to 49 days in January 2019.
Significant home sales declines in the West — down 9.4 percent from December 2019 — were responsible for the dip in the nationwide numbers, but in the Midwest, existing home sales grew 2.4 percent in January, an 8.4 percent increase year over year. Median prices in the region were up 5.4 percent year over year to $200,000.
Across the country, the good news is that first-time homebuyers are gradually coming back. They represented 32 percent of existing-home sales in January, up from 31 percent in December and from 29 percent during this time last year.
“It is good to see first-time buyers slowly stepping into the market,” Yun said. “The rise in the homeownership rate among the younger adults under 35 and minority households means an increasing number of Americans can build wealth by owning real estate. Still, in order to further expand opportunities, significantly more inventory and home construction are needed at the affordable price points.”
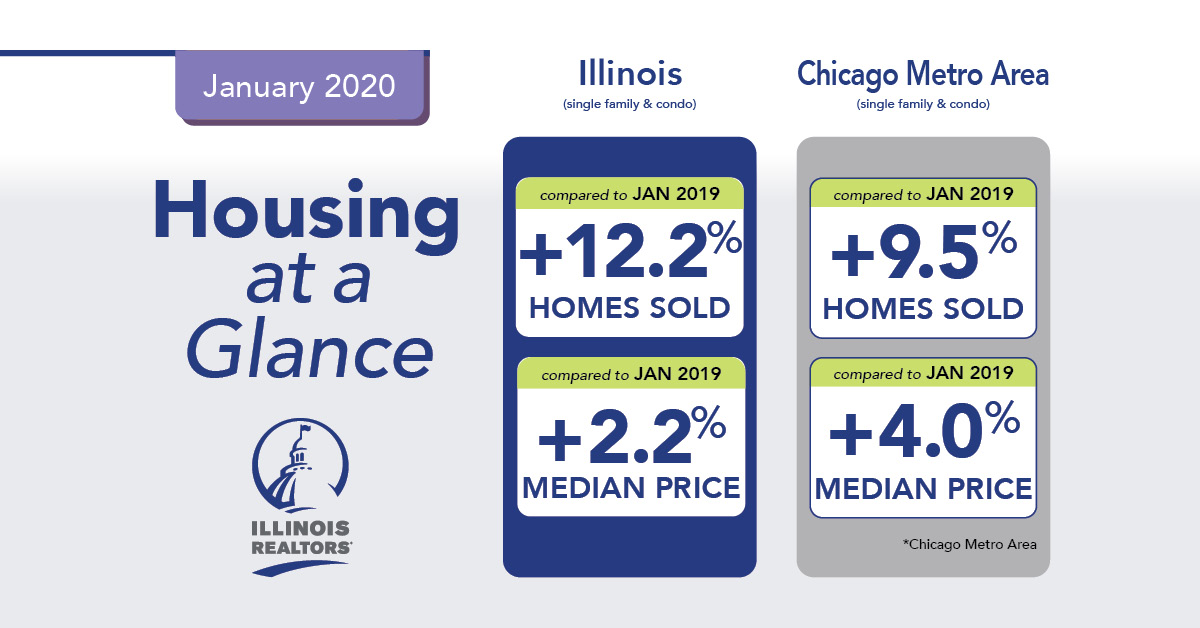
In terms of the local numbers, Illinois outperformed the national picture by a decent amount. The state saw a 12.2 percent increase in home sales from January 2019. Chicagoland saw a slightly less impressive increase in activity, with a 9.5 percent year-over-year increase in home sales in the nine-county area Illinois Realtors defines as the Chicago metro area. And while the city of Chicago also saw an increase in sales, it mirrored Chicagoland in terms of underperforming compared to statewide figures, with a 5.9 percent boost year over year.
Prices were also higher, though not by quite as big of a margin as home sales saw. Chicagoland’s median price was $233,000 in January, an increase of 4 percent from last year. City prices were up by 5.5 percent over January 2019, to $269,000.
Chicago Association of Realtors President Maurice Hampton blamed the slower gains in Chicagoland on a lack of inventory. “We continue to see a downturn in inventory. The combination shows we still have demand, but without the inventory to show for it,” the owner of Centered International Realty said in a press release revealing the latest data.
While homes are taking a bit longer to sell, there is indeed less on the market than last year. The average days on market was 66 in January, an increase of 4.8 percent from last year. Inventory came out to 44,880 homes for sale, a 7.7 percent decline from January 2019.
Geoffrey J.D. Hewings, director of the Regional Economics Applications Laboratory at the University of Illinois, agreed with Hampton’s analysis: “The major concern continues to be the amount of inventory for sale,” he said. “The pending sales index suggests this momentum may be sustained for the next several months and consumers are optimistic about the short- and medium-term prospects for the economy.”