It’s clear we’re in a transitional real estate market at the moment, but the destination isn’t quite as obvious. While this year has been notoriously difficult to predict in terms of home sales, there are three indicators that can point to the future of your business in a pretty reliable way: pending home sales, new-construction activity and listing traffic.
Sales in the pipeline
Today, the National Association of Realtors released their latest report on contract signings, which revealed a slight decline. The forward-looking Pending Home Sales Index fell 1.5 percent over the month of April. Compared to this time last year, contract signings were down 2 percent, which NAR noted made this the 16th straight month of annual decreases.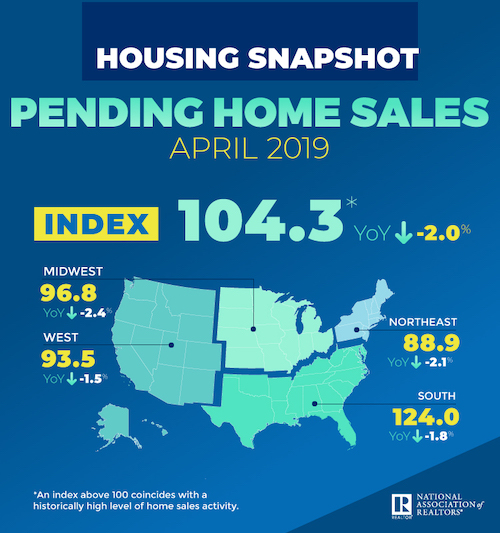
Even though pending home sales are a leading indicator for the market overall, NAR Chief Economist Lawrence Yun noted that there are other, more recent factors that may bode for a better summer than the numbers indicate. “Though the latest monthly figure shows a mild decline in contract signings, mortgage applications and consumer confidence have been steadily rising,” he said in a release accompanying today’s report. “It’s inevitable for sales to turn higher in a few months.”
And there’s another bright spot in the data for Chicagoland: As was seen in recent home sales data, the market in the Midwest appears to be faring better than others. It was the only region that didn’t record a drop in contract activity, with the index growing 1.3 percent to 96.8 in April, (though this level is 2.4 percent lower than last year at this time).
Still, Yun specifically called out the higher end of the market in Chicago’s home state as a place of vulnerability. “Price conditions are soft on the upper end, especially in high tax states like Connecticut, New York and Illinois,” he said. “The supply of inventory for homes priced under $250,000 stood at 3.3 months in April, and homes priced $1 million and above recorded an inventory of 8.9 months in April.”
Builders squeezed out beyond the ‘burbs
In a market ruled by inventory levels, new-home construction is also an important leading indicator. And an interesting trend emerged from the National Association of Home Builders’ quarterly Home Building Geography Index this month. In the first quarter of 2019, the only geographic type that registered any growth in single-family permits issued was the exurbs. Such areas are generally defined as farther-flung suburbs that attract wealthy families.
Outlying counties in large metro areas (defined as having more than 1 million in population) accounted for 9 percent of single-family construction for the first quarter of 2019. In that time period, the growth rate in those areas, which include parts of DeKalb County, Grundy County, Jasper County and Newton County, was 6.1 percent, with a 1.6 percent year-over-year increase.
Homebuilders cited construction costs as the primary reason for this finding. “Housing affordability is a root cause of soft single-family permit issuance nationwide,” said NAHB Chairman Greg Ugalde. “A shortage of buildable and affordable lots is forcing builders to increasingly look further outside of suburban and metropolitan areas to find cheaper land that provides more building opportunities.”
NAHB Chief Economist Robert Dietz agreed, noting that because suburbs and smaller cities are seeing rapid price increases, exurbs are winning the building war. “Housing costs are increasing fastest in large metro suburban counties and smaller metro areas with populations under 1 million where demand for housing is high but supply constraints are tight,” he said. “Supply-side issues that are hurting affordability and raising costs for builders include excessive regulations, labor shortages, rising material costs and a dearth of buildable lots in mid- to high-population centers.”
Buyer traffic slows
A final leading indicator to watch on the residential front is the volume of buyers who are out looking at houses. ShowingTime, a Chicago-based showing software and market statistics service provider for the residential market, puts together a monthly index measuring this activity, and the April data is not all that positive. In fact, the index showed the ninth straight month of decline in showing activity nationwide. But in the Midwest, the news was again better than it was elsewhere. While the West and South saw declines of 11.1 and 8.1 percent respectively, Chicago’s home region only clocked a 7.1 percent decline year-over-year, which was actually a smaller annual drop than we saw during the first three months of the year respectively.
Of course, this doesn’t measure all the showing activity out there. The company bases its reports on a representative sample of more than 100,000 listings from 25 local markets across the United States, focusing on properties listed by agents subscribing to ShowingTime’s software. Though another commonly cited report measuring this activity from Sentrilock hasn’t come out for April yet, their March foot traffic report also recorded a slight decline.
Still, with the competitive year 2018 turned out to be for those on the house hunt, it’s likely many buyers’ agents bringing clients out to listing appointments are thankful for the increased breathing room.