A recent study conducted by LendingTree analyzed where in the U.S. home prices were the most divergent. This provides a measure of inequality in real estate that speaks to the housing affordability crisis that many Americans face. On the other hand, as LendingTree chief economist Tendayi Kapfidze found, greater price inequality could also imply a broader range of options for buyers at different price points.
“Cities with more home value inequality have a wider distribution of home values, which means that families earning lower incomes may still have the opportunity to access homeownership in these cities,” Kapfidze wrote in the report. “The concurrent presence of high value homes suggests that their economies are vibrant enough to support higher earning jobs as well. Looked at in this manner, home value inequality could be beneficial.”
LendingTree ranked price inequality among the 50 largest metro areas using the Gini coefficient, a statistical model applied across many fields of economic research to measure inequality. The Gini coefficient is most known for its application in studies of income and wealth inequality throughout the world. A higher Gini coefficient (on a scale from zero to 1) implies a greater degree of economic inequality between the subjects surveyed. For reference, according to data from the World Bank, the income of the entire U.S. population produced a Gini coefficient of 0.415 in 2016.
LendingTree’s analysis found Detroit’s housing market posted the highest level of price inequality, with a Gini coefficient of 0.446. In other words, the average price of the top 5 percent of homes in Detroit ($431,000) was 13.5 times higher than that of the bottom 5 percent ($32,000). Salt Lake City fell on the other end of the scale with a Gini ratio of 0.210. Homes in the 95th percentile of Salt Lake City’s price range ($597,000) were only 3.1 times more expensive than those in the 5th percentile ($191,000).
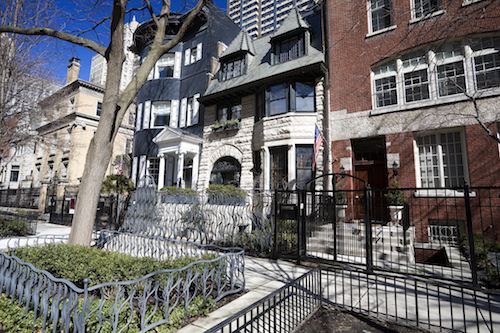
Cities in the Midwest posted some of the highest rates of price inequality among the 50 metros surveyed by LendingTree. At the No. 8 spot, Chicago was the largest city to achieve a high ranking of price inequality with a Gini coefficient of 0.355. Homes in the top 5 percent of the price range in Chicago were 9.8 times more expensive than the bottom 5 percent.
LendingTree found that the 10 most unequal cities in its study tended to have a surplus of very low-priced homes, with the 5th percentile in these areas averaging only $48,500. However, many of the most equally priced markets were located in cities like San Jose, California and Denver, where a lack of affordable housing has emerged as a major issue.
Read the full report from LendingTree and the price equality rankings for all 50 metro areas here.