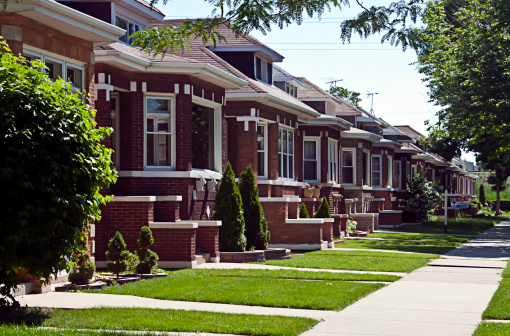
See our chart below for the top-selling neighborhood housing markets in Chicago in all of 2016, according to research from Redfin.
To adjust between total home sales and the single-family/condo markets, click on the tabs. When possible, we have also noted how 2016’s sales compared with 2015’s sales.
| Suburb | 2016 Home Sales | 2015 Home Sales | YOY Change |
|---|---|---|---|
| Near North Side | 2,737 | 2,780 | -1.50% |
| West Town | 1,887 | 1,755 | 7.52% |
| Lincoln Park | 1,616 | 1,497 | 7.95% |
| South Loop | 1,293 | 1,170 | 10.51% |
| Uptown | 982 | 817 | 20.20% |
| Near South Side | 923 | 890 | 3.71% |
| Edgewater | 891 | 763 | 16.78% |
| The Loop | 853 | 805 | 5.96% |
| West Loop | 852 | 849 | 0.35% |
| Logan Square | 809 | 566 | 42.93% |
| Suburb | 2016 Single-Family Home Sales | 2015 Single-Family Home Sales | YOY Change |
|---|---|---|---|
| Portage Park | 473 | 404 | 17.08% |
| Ashburn | 470 | 446 | 5.38% |
| Dunning | 448 | 405 | 10.62% |
| Norwood Park | 410 | 411 | -0.24% |
| Garfield Ridge | 378 | 353 | 6.52% |
| Austin | 312 | 213 | 46.48% |
| Irving Park | 303 | 266 | 13.91% |
| West Lawn | 265 | 262 | 1.15% |
| West Town | 228 | 243 | -6.17% |
| Jefferson Park | 226 | 204 | 10.78% |
| Suburb | 2016 Condo Sales | 2015 Condo Sales | YOY Change |
|---|---|---|---|
| Near North Side | 2705 | 2,749 | -1.60% |
| West Town | 1510 | 1,512 | -0.13% |
| Lincoln Park | 1362 | 1,300 | 4.77% |
| South Loop | 1291 | 1,167 | 10.63% |
| Uptown | 934 | 789 | 18.38% |
| Near South Side | 921 | 888 | 3.72% |
| The Loop | 853 | 799 | 6.76% |
| West Loop | 847 | 847 | 0.00% |
| Edgewater | 756 | 692 | 9.25% |
| Streeterville | 630 | 653 | -3.52% |
| Logan Square | 479 | 375 | 27.73% |
