The government came out with its latest report on new home sales late last week, but what do all those numbers actually mean?
We’ll get the obvious information out the way first: according to the latest numbers from the Census Bureau, new home sales in April increased 6.4 percent from March to a seasonally adjusted annual rate of 433,000.
Though that’s likely information that you’ve already seen in other publications, we figured that we’d take a closer look at not only that stat, but some of the other details in the Census Bureau’s report, and provide you with a fuller picture of what’s really going on in new home sales:
1. Sales are Still Down by Yearly Measures – Yes, new home sales did rise from March to April, a development that we certainly won’t complain about; however, even with that increase, sales are still down by 4.2 percent from April 2013’s rate of 452,000, showing that housing remains behind its exuberant levels of a year ago.
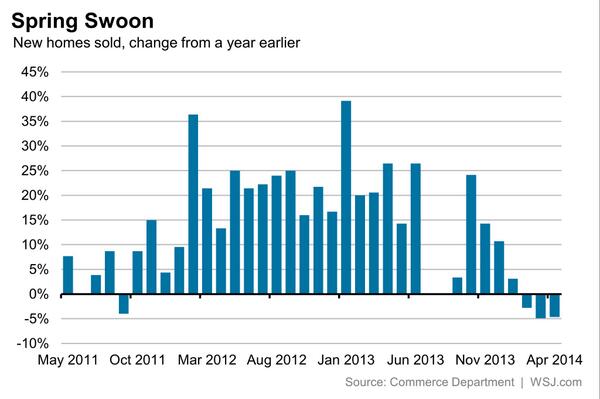
2. Sales are Consistently Down by Yearly Measures – April, though, was no anomaly when it comes to year-over-year declines. In fact, new home sales have been down by nearly measures the last three months. Here’s an excellent chart from the Wall Street Journal that demonstrates the current trend:
3. Inventory is Making Progress – The inventory of new homes for sale is still less than half of what it was in 2007, but at 5.3-months supply, it’s actually making progress. In fact, new home inventory is up 25 percent from where it was a year ago, and is now at a three-year high.
4. New Homes are Still Darned Expensive – One thing that hasn’t changed is the rising price of new homes. According to the Census Bureau, the median sales price for new homes in April was $275,800, which is the fourth highest in the history of data keeping (non-inflation adjusted, of course). The average sales price, meanwhile, was an imposing $320,100.
5. Nowhere to Go But Up – Another thing that hasn’t changed is the topsy turvy ratio of existing-home sales to new home sales, which has been way out of whack since the housing downturn. Typically in the 6:1 range, the existing-to-new ratio has been in the 10:1 range in the post-bubble market, and in April, it was nearly 11:1! Such a pattern, though, will not continue, so you can expect new home sales to increase and for the market to balance out.