By the Numbers

Sales rose 9.5% from January to a seasonally adjusted annual rate of 4.38 million.
The median existing-home price for all housing types was $379,100, up 5.1% from $360,800 a year before.
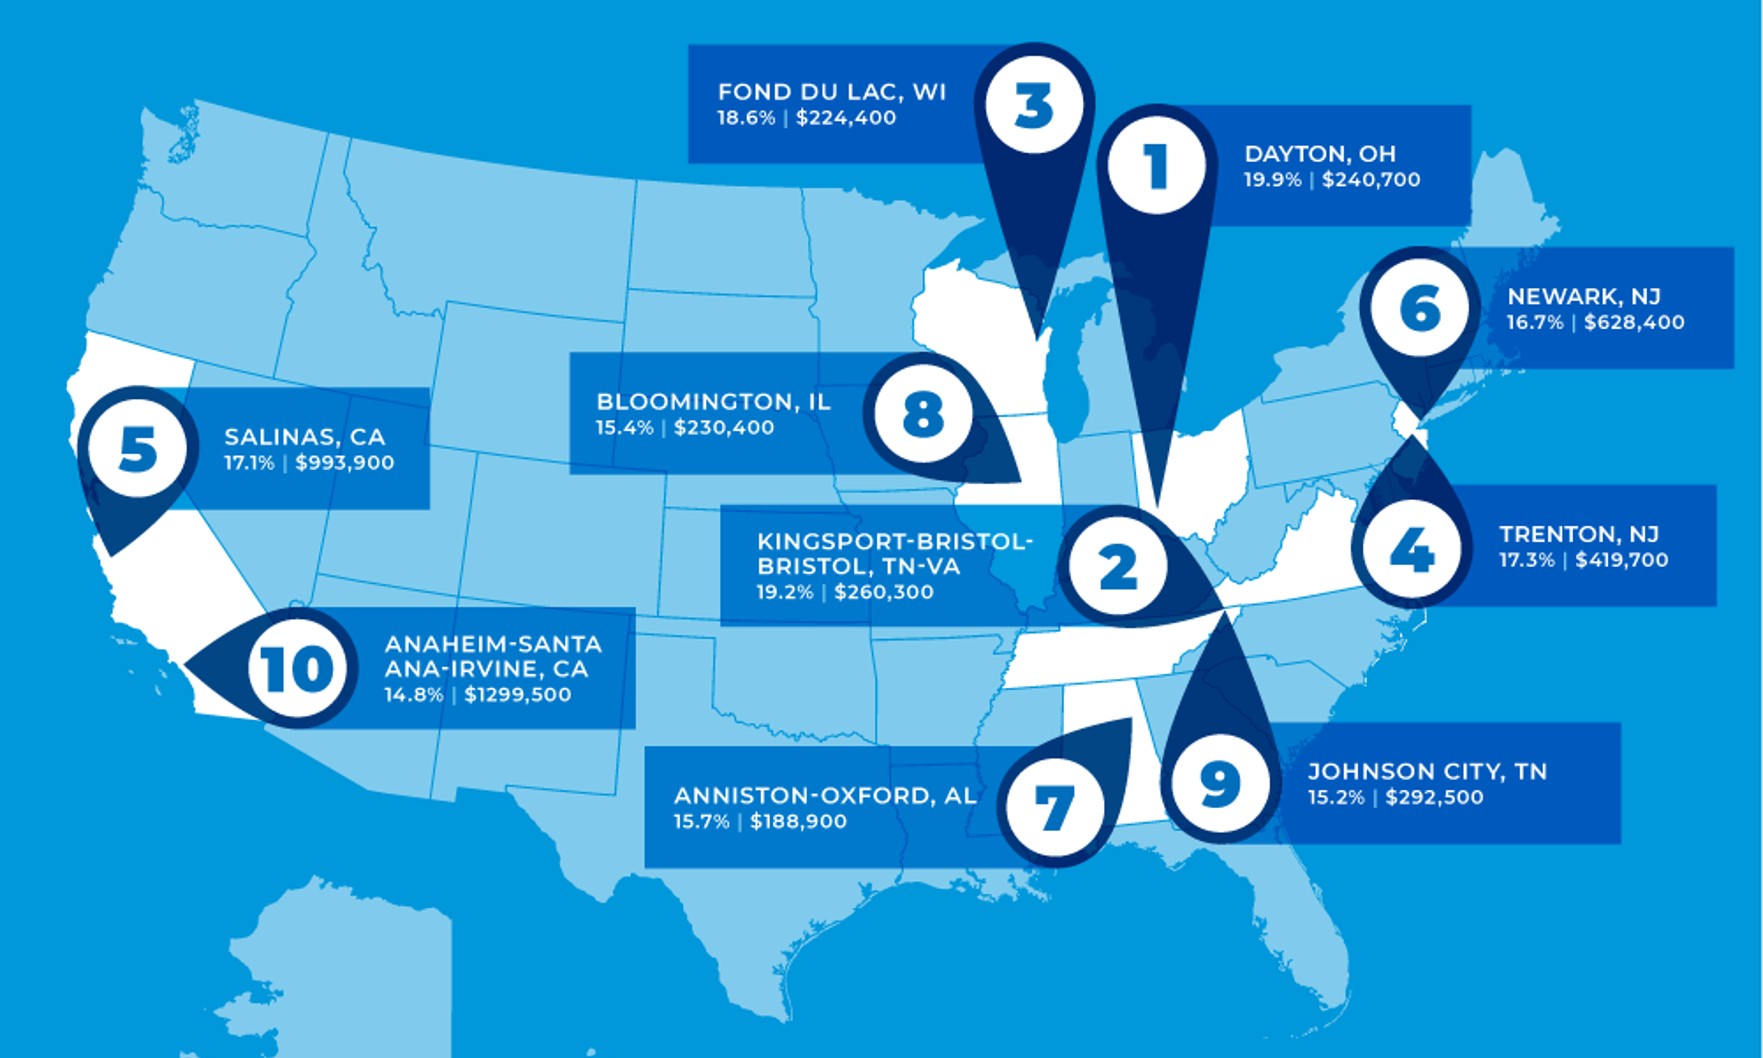
Single-family home sales prices increased in 189 out of 221 metro areas analyzed, with the median single-family price in the country rising 3.5% year over year to $391,700.

Pending home sales rose 8.3% month over month, the National Association of REALTORS® said, marking the largest monthly jump since 2020.

Declining interest rates spurred the increase.
At the same time, the median sales price rose 4.4% to $382,600.

The NAHB/Wells Fargo Housing Market Index (HMI) rose seven points to 44, its second monthly increase in a row.
CoreLogic expects prices to continue to grow through the year.
The only region of the U.S. that didn’t experience an annual decline in existing home sales was the Midwest, where sales were unchanged year over year.
The median price of a new home sold during the month fell to $418,800 from $433,100 in August, the U.S. Census Bureau and the U.S. Department of Housing and Urban Development reported.

The median existing-home price for all housing types in September was $394,300, up 2.8% from $383,500 in September 2022.
Specifically, single-family homes were built at a seasonally adjusted annual rate of 963,000, up 3.2% from 933,000 in August and up 8.6% from 887,000 a year earlier, according to government figures.

A 15% rise in applications for adjustable-rate mortgages drove overall mortgage applications higher in the most recent weekly survey.
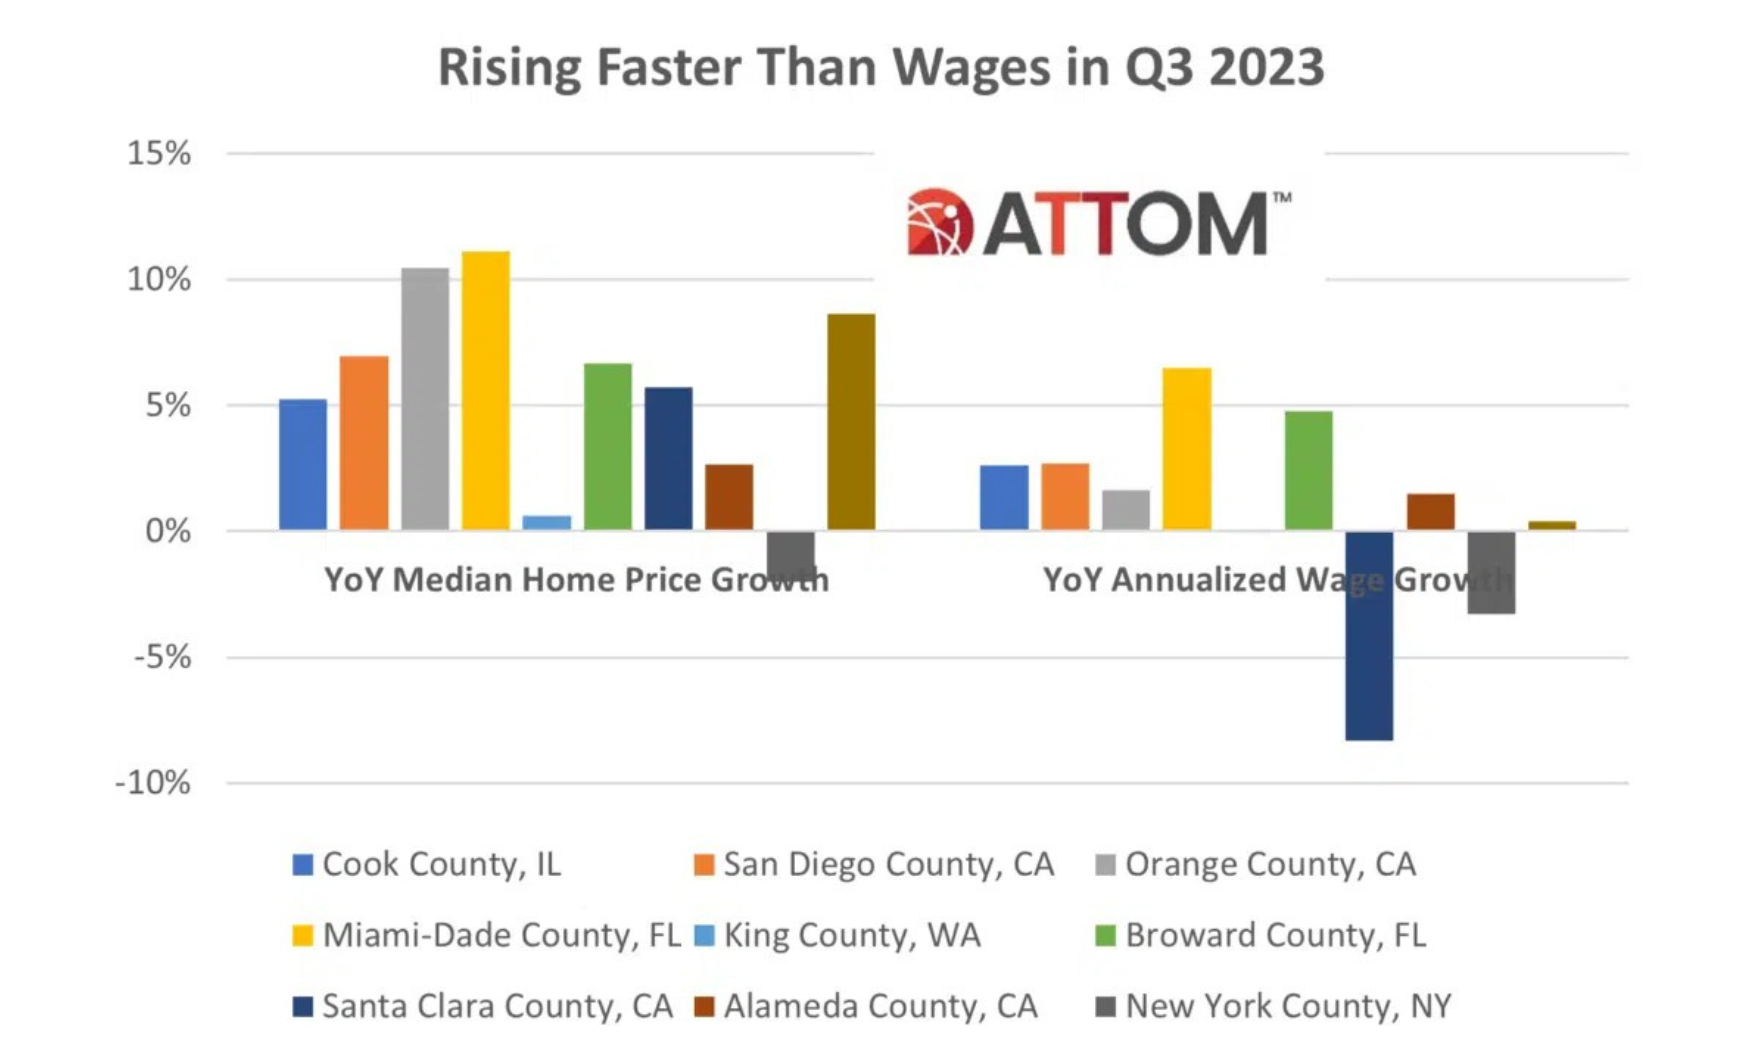
Housing affordability has worsened in many parts of the country as wages fail to grow at the same pace as home prices.

Regionally, pending sales were down across the board on both a monthly and an annual basis, the National Association of REALTORS® said.
Total housing inventory at the end of August was 1.11 million units, up 3.7% from July but down 14.6% on a year-over-year basis, the National Association of REALTORS® said.